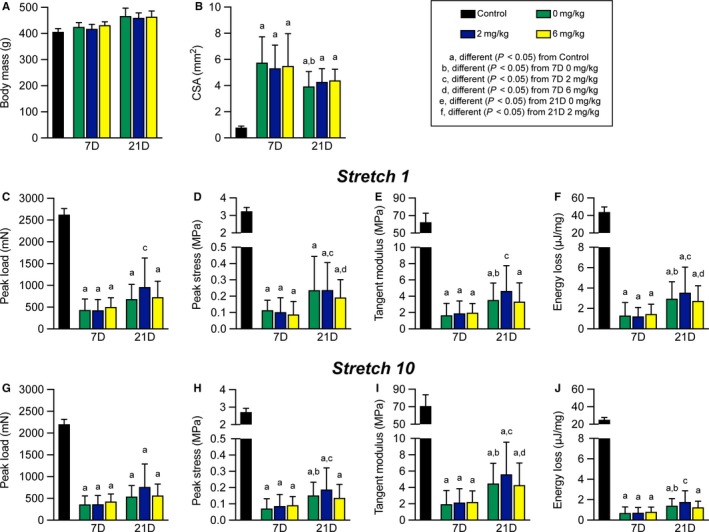
Figure 3.

Mechanical properties of repaired plantaris tendons. (a) Animal body mass at the time of sacrifice, and (b) nominal cross‐sectional area (CSA) of plantaris tendons. (c) Peak load, (d) peak stress, (e) tangent modulus, and (f) energy loss of tendons from the first of ten stretch cycles. (g) Peak load, (h) peak stress, (i) tangent modulus, and (j) energy loss of tendons from the last of ten stretch cycles. Values presented as mean ± SD. Differences between groups were assessed using a Kruskal–Wallis test followed by a Benjamini–Krieger–Yekutieli FDR correction (α = .05) to identify post‐hoc differences between groups: a, different (FDR‐adjusted p < .05) from control tendons; b, different (FDR‐adjusted p < .05) from 7D 0 mg/kg; c, different (FDR‐adjusted p < .05) from 7D 2 mg/kg; d, different (FDR‐adjusted p < .05) from 7D 6 mg/kg; e, different (FDR‐adjusted p < .05) from 21D 0 mg/kg; f, different (FDR‐adjusted p < .05) from 21D 2 mg/kg. N = 5 tendons for controls, and N = 12 tendons for each surgical repair group
