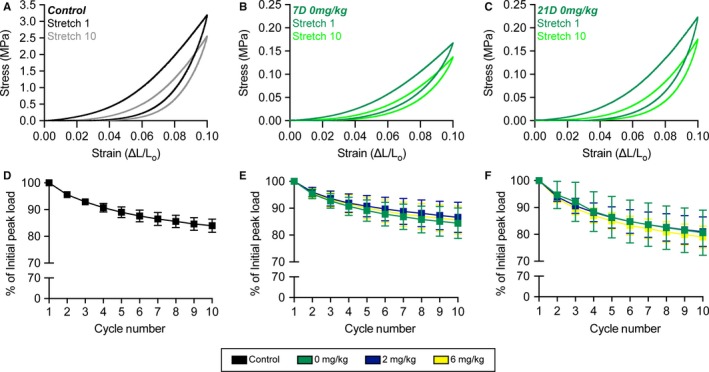
Figure 4.

Stress–strain curves and peak load changes during stretch. Representative stress–strain response of a (a) control tendon, and (b) 7D 0 mg/kg GSK2894631A (c) 21D 0 mg/kg GSK2894631A repaired tendons from cycles 1 (darker color) and 10 (lighter color). Change in peak load across the ten cycles from (d) control tendons, and (e) 7D and (f) 21D repair groups
