
Figure 2.
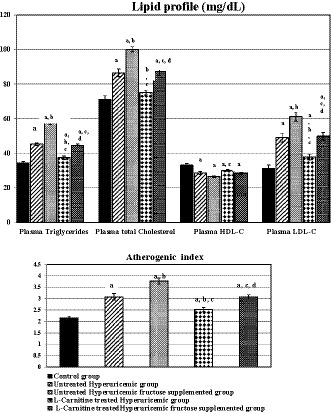
Lipid profile changes in plasma in the different studied groups. Number of rats in each group is 10 rats. (a) Significance by LSD at p < .05 compared to control group (I). (b) Significance by LSD at p < .05 compared to untreated hyperuricemic group (II). (c) Significance by LSD at p < .05 compared to untreated hyperuricemic fructose‐supplemented group (III). (d) Significance by LSD at p < .05 compared to l‐Carnitine‐treated hyperuricemic group (IV)