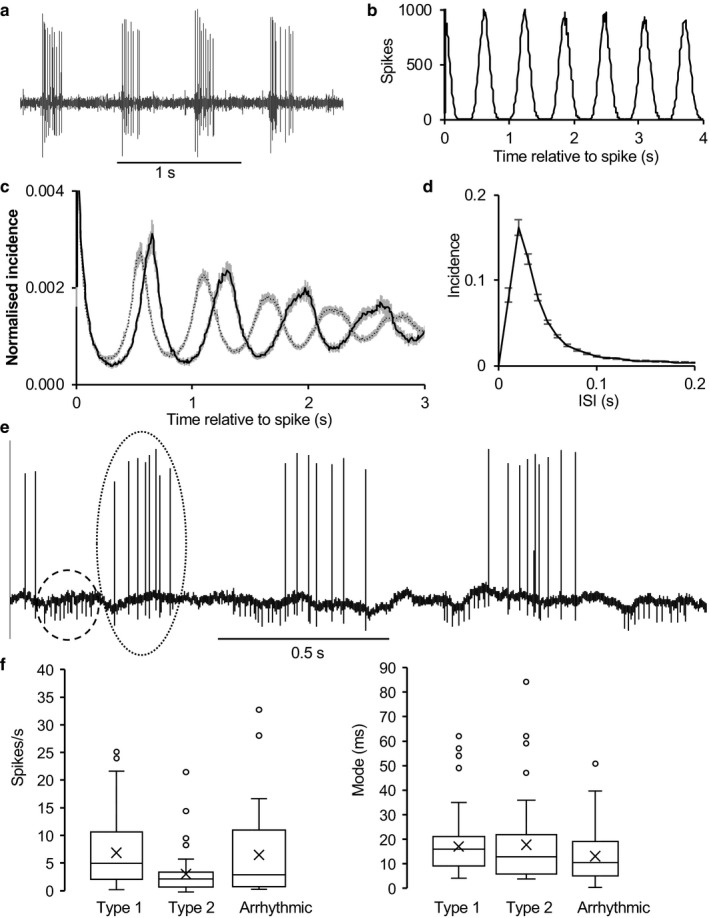
Figure 2.

Type 1 neurons in the AON. (a) Extract of voltage trace of a typical type 1 neuron. (b) Autocorrelation of spike activity of the neuron in A showing discharge activity with a period of ~600 ms. (c) Normalized autocorrelations from type 1 neurons sorted according to period of rhythm (500–600 ms dotted line, n = 67; 600–700 ms solid line, n = 50). Means ± SE. (d) Consensus ISI distribution for 143 type 1 cells (means ± SE). (e) Pair of type 1 neurons, displaying bursts with a period of about 600 ms. Bursts in the smaller cell (one burst circled in dashed line) are out of phase with bursts in the larger cell (circled in dotted line). (f) Box plots showing mean and interquartile ranges, median (X) and outliers (circles) for spontaneous firing rates (left and modal ISI (right) for the three groups of AON neurons
