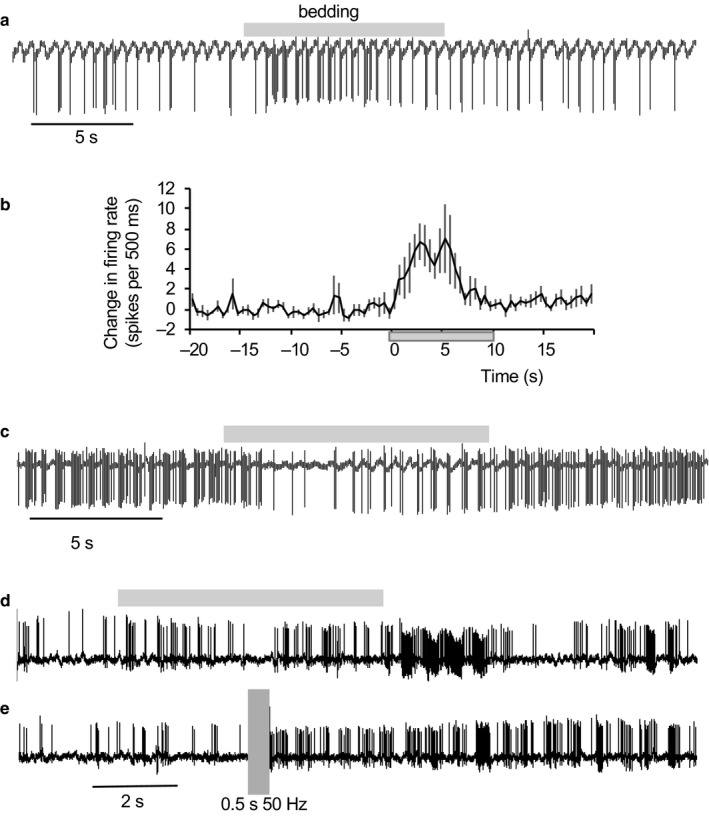
Figure 4.

Responses of AON cells to bedding odor. (a) Example of the response of a type 1 cell to bedding odor (grey bar). (b) Averaged responses (±SE) of 10 type 1 cells that were excited by bedding odor. (c) example of an inhibitory response (one of two cells inhibited). (d) Response of a type 2 cell that was excited after the end of odor application. (e) Response of the same cell to LOT stimulation – the cell was inhibited during stimulation but showed excitation after stimulation
