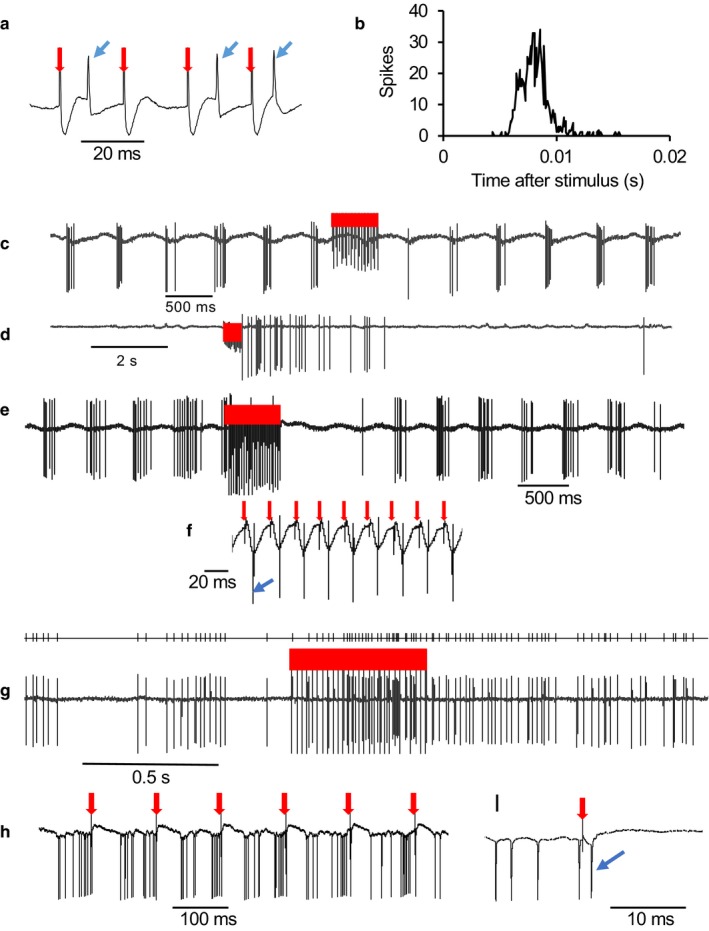
Figure 5.

Effects of LOT stimulation on type 1 neurons. (a) Extract of voltage trace showing spike responses (blue arrows) during a train of stimuli (red arrows) at 50 Hz. (b) Post‐stimulus time histogram of the response of a type 1 neuron activated by stimulation of the LOT with a latency of about 7 ms. (c) A neuron inhibited by LOT stimulation (red bar) at 50 Hz. (d) A neuron activated after the end of LOT stimulation (red bar) (e) A neuron excited during LOT stimulation (red bar) but inhibited after. (f) Expanded voltage trace from E showing that each stimulus pulse (red arrows) is followed by a spike (the first indicated by the blue arrow). (g) A neuron progressively excited during LOT stimulation (red bar) with prolonged post‐stimulus activation. The top trace shows detected spikes. (h) This neuron was synaptically activated by LOT stimulation (red arrows) but each activation was followed by inhibition. (i) Expanded voltage trace from H showing spike (blue arrow) following stimulus (red arrow)
