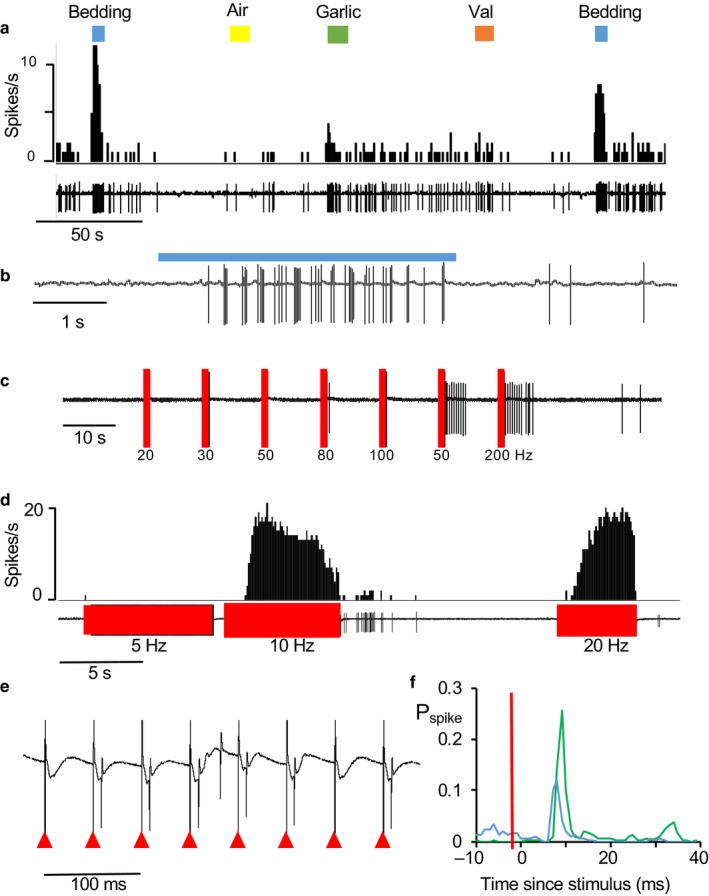
Figure 6.

Response of a type 1 cell to odors and stimulation of the LOT. (a) This neuron was repeatably activated by bedding odor (blue bars), unaffected by air (yellow bar) or valderaldehyde (val, orange bar), and weakly activated by garlic (green bar). (b) Expansion of the response to bedding showing clear rhythmic discharge during odor application. (c) Response to trains of stimulation at the frequencies shown. During tests, the cell fell silent and was unresponsive to brief stimulation at 20, 30, and 50 Hz but was activated after stimulation at 150 and 200 Hz. (d) Responses to continued lower frequency stimulation. Stimulation at 10 and 20 Hz produced excitation after a delay. (e) Voltage record of the response during activation by 20 Hz stimulation – the stimulus artefacts are marked by the red arrowheads. (f) Peri‐stimulus histograms of responses to stimulation at 10 Hz (green) and 20 Hz (blue, expressed as the probability of a spike occurring in 1 ms bins (Pspike). The stimulus time is marked by the red bar
