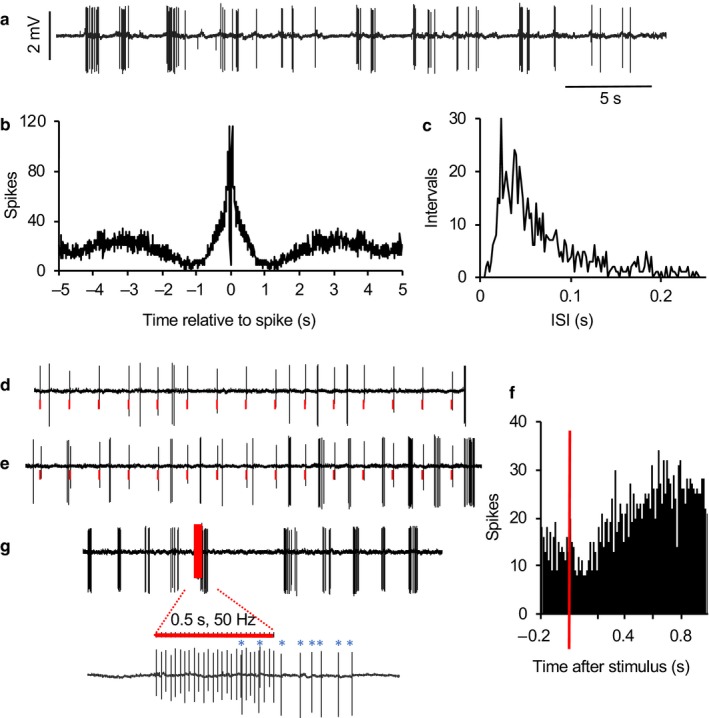
Figure 7.

Response of a type 2 cell to stimulation of the LOT. (a) Extract of spontaneous activity of a type 2 neuron showing intermittent bursts with a period of about 2 s. (b) Autocorrelation histogram, typical of type 2 cells. (c) ISI distribution shows the typical unimodal, skewed distribution. (d) During 1 Hz stimulation of the LOT (artefacts marked in red in voltage trace), the cell initially was unresponsive. (e) With continued stimulation, bursts arose entrained by the stimuli. (f) Peri‐stimulus time histogram, revealing post‐stimulus inhibition followed by prolonged excitation. (g) The response to a brief train of stimulation at 50 Hz, showing delayed activation that outlasted the simulation
