Figure 8.

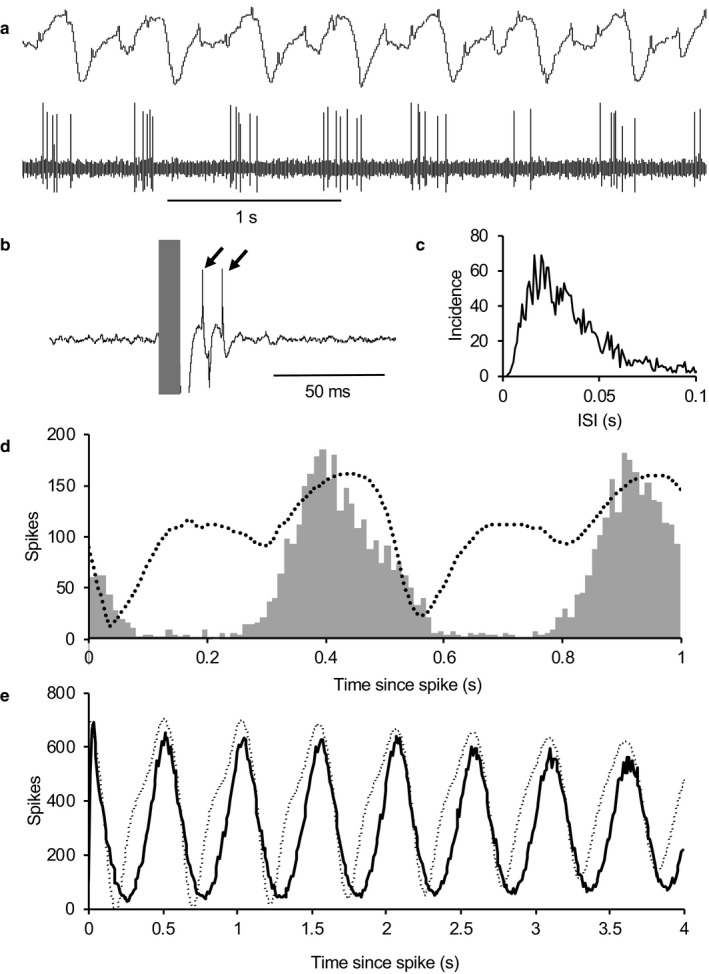
Type 1 neurons that are activated during inspiration are activated by LOT stimulation. (a) Extract of recording of respiratory activity in conjunction with recording the spontaneous activity of a type 1 neuron. (b) Identification of this neuron as activated by LOT stimulation. The shaded bar covers the stimulus artefact accompanying a stimulus pulse applied to the LOT; the pulse is followed by two spikes from this neuron (arrowed) and a smaller spike (with a negative going waveform) from a second, almost silent neuron. (c) ISI distribution from this neuron, typical of type 1 neurons. (d) Spike activity relative to respiratory cycle. During 300 s of spontaneous activity, the time of the peak inspiration in each respiratory cycle was marked, and the dotted line shows the average cycle produced from these triggers. The histogram shows the spike activity in 10 ms bins triggered in the same way. (e) Respiration relative to spike activity. The solid line shows the conventional autocorrelation histogram for this cell – this is a spike‐triggered average of spiking activity. The dotted line shows the directly corresponding spike‐triggered average of respiratory activity. Both (d) and (e) show, in slightly different ways, that the bursts in this cell were consistently initiated during inspiration
