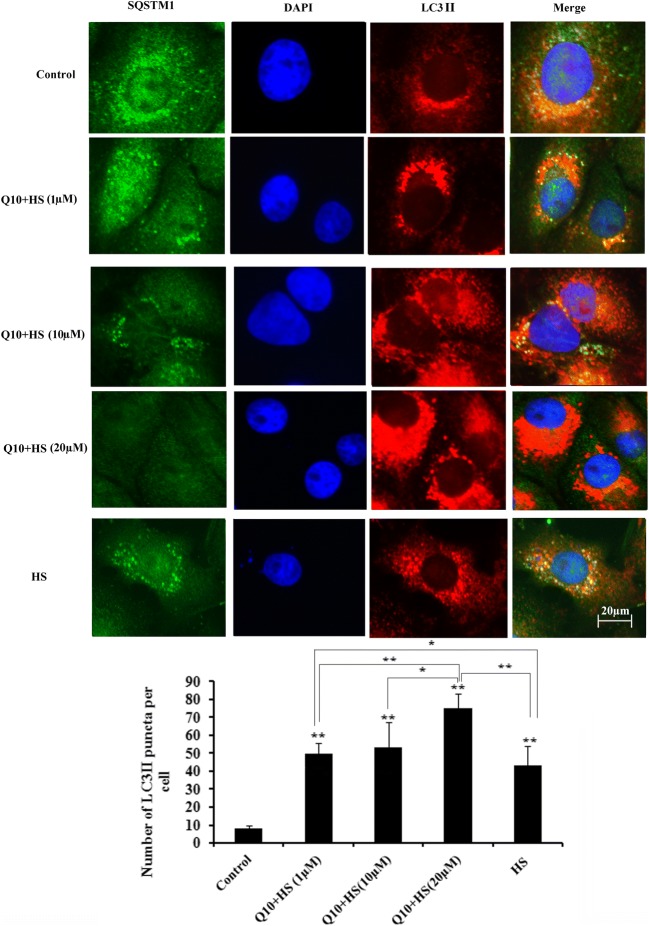
Fig. 8.
Distribution of SQSTM1, LC3II, and the number of LC3II puncta in myocardial cells during heat stress. The number of LC3II puncta was quantified, and 20 μM Q10 treatment resulted in significantly more LC3II puncta accumulation compared with the heat stress control group. Nuclei (DAPI, blue), SQSTM1 (FITC, green), LC3II (Rhodamine, red). Scale bar = 20 μm. Values represent the means ± SE. *P < 0.05; **P < 0.01. The asterisks immediately above each bar indicate significance from the control. The asterisks immediately above each line indicate significance between different groups linked by line

