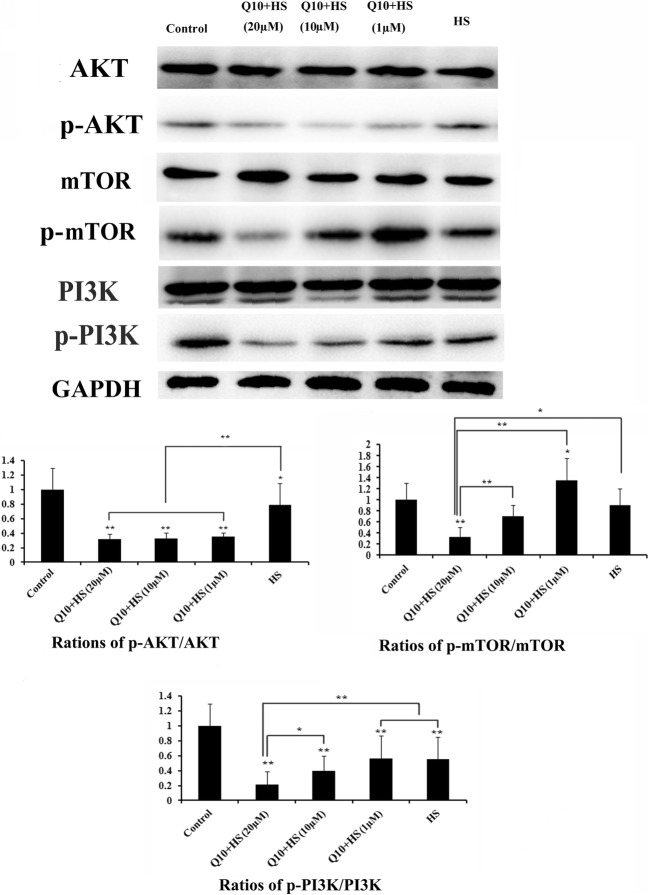
Fig. 9.
Expression of AKT, mTOR, PI3K, p-AKT, p-mTOR, and p-PI3K. Expression of AKT, PI3K, and mTOR was not influenced by heat stress and addition of Q10. Expression of p-AKT, p-mTOR, and p-PI3K was normalized to the intensity obtained for the blot of the relevant total protein. Only treatment with 20 μM Q10 significantly downregulated the expression of p-AKT, p-mTOR, and p-PI3K during heat stress. Values represent the means ± SE. *P < 0.05; **P < 0.01. The asterisks immediately above each bar indicate significance from the control. The asterisks immediately above each line indicate significance between different groups linked by line

