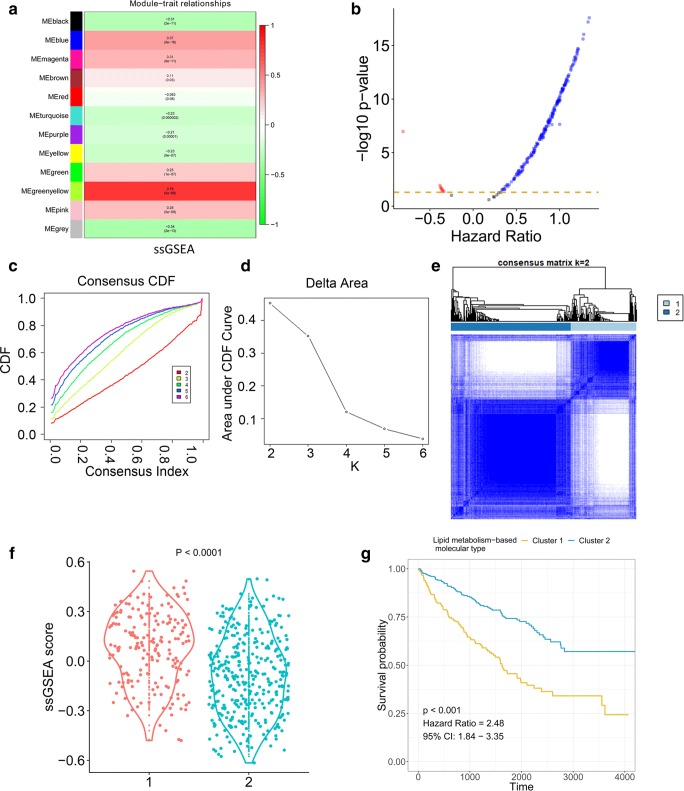
Fig. 2.
Identification of novel molecular subtypes. a Correlation between modules and ssGSEA score. b Cox coefficients and p values from univariate Cox regression for the genes in the greenyellow module. c Consensus clustering cumulative distribution function (CDF) for k = 2 to 6. d Relative change in the area under the CDF curve for k = 2 to 6. e Consensus matrix similarity for 2 clusters in the ccRCC cohorts. f Membrane lipid metabolism ssGSEA distribution in two clusters. g Kaplan-Meier plot for patients in cluster 1 and cluster 2

