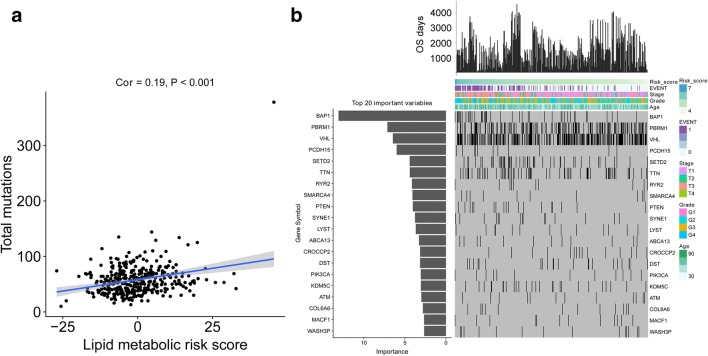
Fig. 5.
Random forest identified the most important gene mutations. a Correlation between the membrane lipid metabolism–based signature and somatic mutations. b Distribution of somatic mutations correlated with the membrane lipid metabolism–based signature. The upper bar plot indicates OS per patient, whereas the left bar plot shows the importance of the somatic mutations correlated with the membrane lipid metabolism–based signature

