Fig. 7.
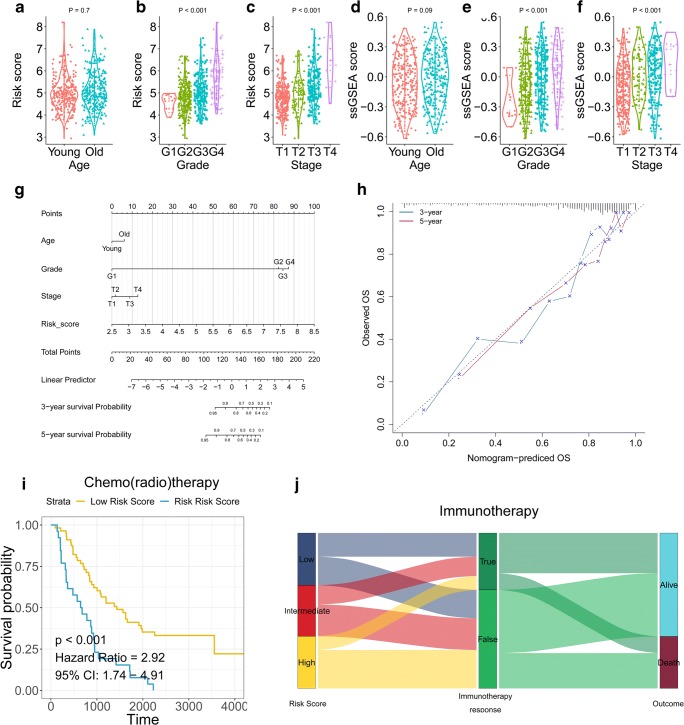
A nomogram was constructed to personalize risk for individual patients. a–c Risk score distribution in young and old, histologic G1–G4, AJCC Stage 1–4 status. d–f Membrane lipid metabolism ssGSEA distribution in young and old, histologic G1–G4, AJCC Stage 1–4 status. g Nomogram. h Calibration curves of survival prediction at different times were close to ideal performance. i, j Patients with higher risk score exhibited worse overall survival among those who received adjuvant therapies including chemo(radio)therapy and immunotherapy

