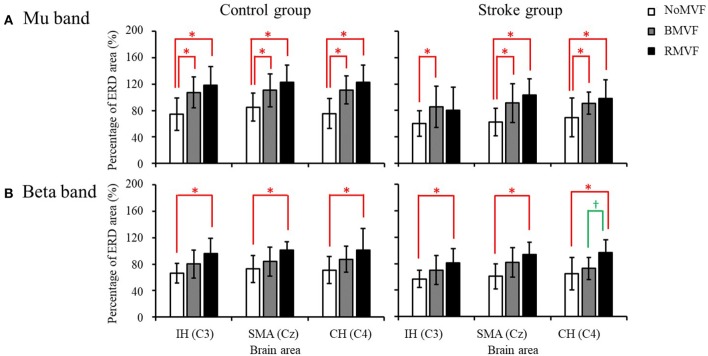
Figure 5.
Overall event-related desynchronization (ERD) areas of the control and stroke group (n = 16 each) with error bars (standard deviations) for the three test conditions (NoMVF: white; BMVF: gray, and RMVF: black) for the IH (C3), SMA (Cz), and CH (C4) brain areas, respectively. (A) Overall ERD areas (%) of the mu band (B) Overall ERD areas (%) of the beta band. *,†Overall ERD areas (%) of this test condition are significantly higher than the previous one for the same brain area.

