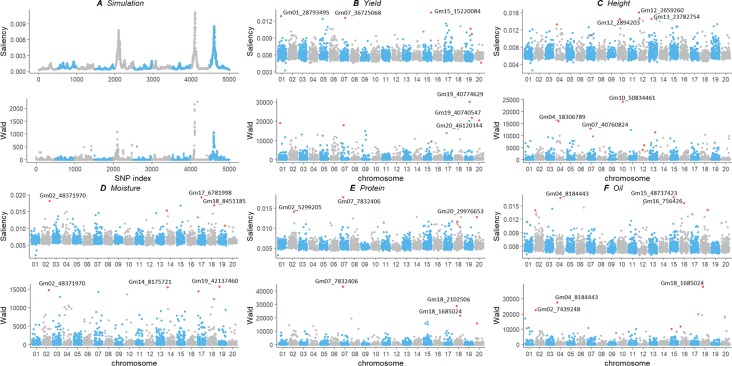
Figure 4.
Comparison of genotype contribution using saliency map and GWAS Wald test of simulation (A) and experimental soybean dataset with five traits (B–F). The x-axis is the index of SNPs in the genotype matrix; the y-axis is the saliency and Wald test results. Top ranked SNPs were plotted in red. GWAS, genome-wide association study; SNP, single-nucleotide polymorphism.

