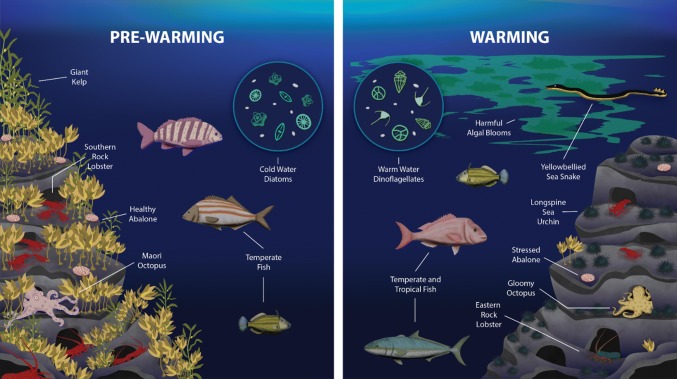
Fig. 1.
Schematic illustrating the key changes in biodiversity on the east coast of Tasmania that are either considered climate-driven changes or are consistent with changes expected under climate change. Although the figure is split into “pre-warming” and “warming” these changes have obviously occurred over time, and some changes are starker than others. All changes depicted are referenced in the main text

