
Figure 3.
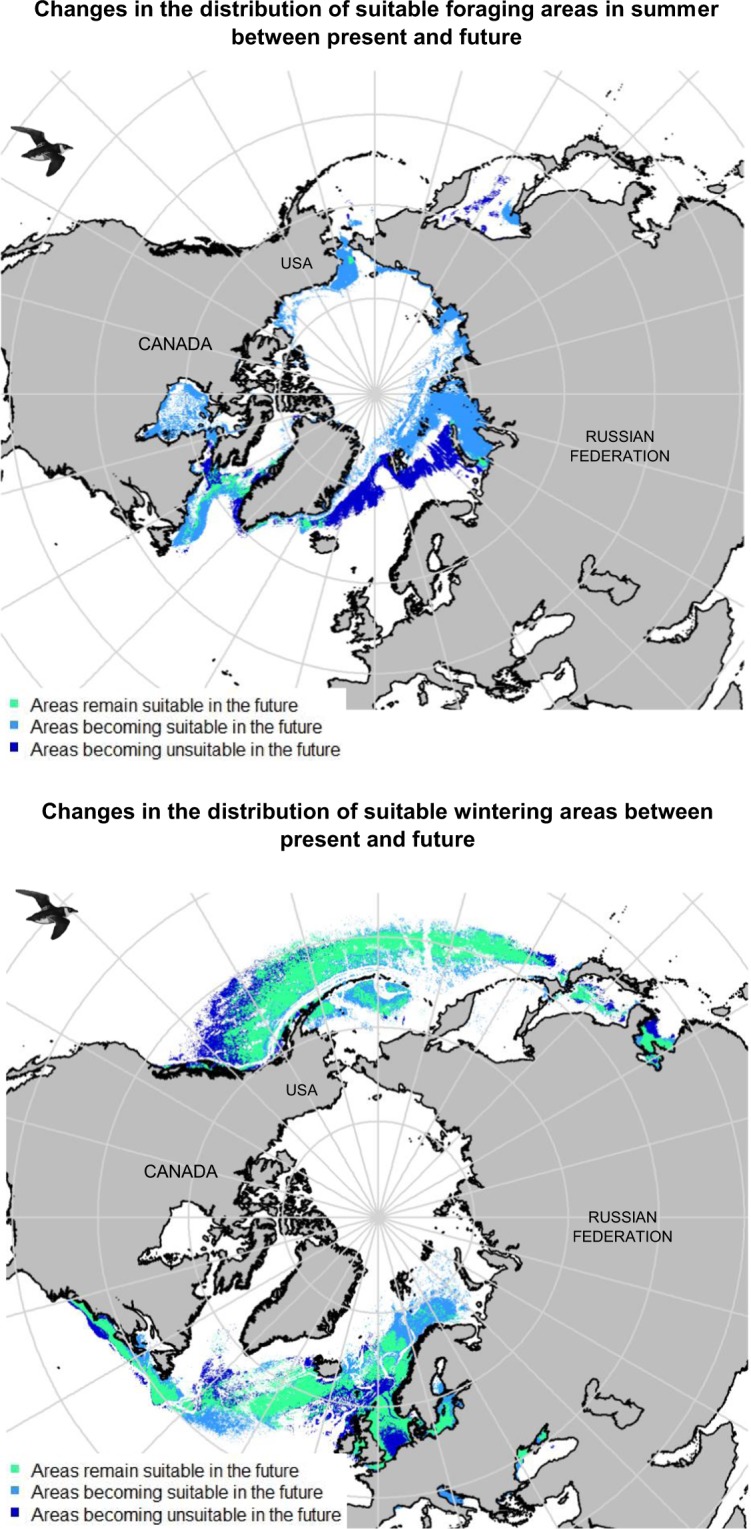
Changes in the potential distribution of suitable foraging and wintering habitats between present (2000–2017) and future (2050–2059, HadGEM2-ES climatic model, RCP 8.5 scenario) projections. This map has been made using R software (version 3.5.1, https://cran.r-project.org/) thanks “maptools”,“rgdal”,“rgeos” and “sp” packages. Little auks drawings used in this figures were extracted from Richard Crossley’s picture (available online under CC-BY-SA license https://creativecommons.org/licenses/by-sa/2.0/legalcode at https://commons.wikimedia.org/wiki/File:Little_Auk_from_the_Crossley_ID_Guide_Britain_and_Ireland.jpg).