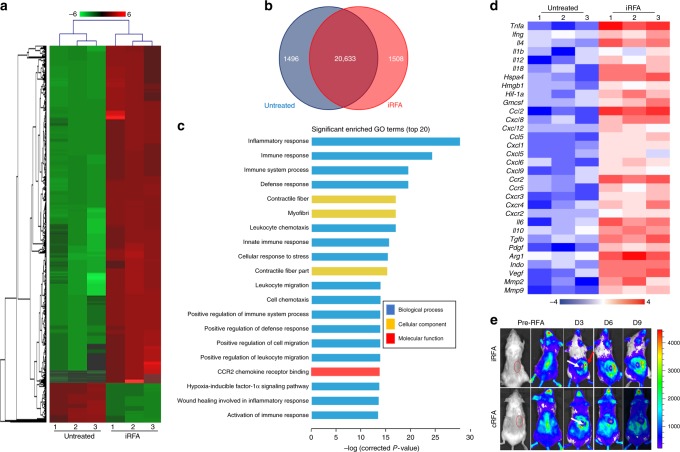
Fig. 3.
iRFA induces local inflammation and upregulates genes associated with immune suppression. a Difference in RNAseq of the untreated and iRFA-treated CT26 tumors on day 3 after iRFA (n = 3). Red and green colors indicate upregulated or downregulated genes. b Overlap in gene expression profiles between untreated and iRFA-treated tumors (n = 3). c Significant enrichment in GO terms (top 20). d Heatmap of mean fold-change of in cytokines and chemokines and genes-associated immunosuppression (n = 3). Red and blue colors indicate upregulated or downregulated genes. e Bioluminescence imaging of BALB/C-Tg (Tnfa-luc)-Xen mice inoculated with complete or incomplete ablation of the implanted CT26 tumors (red circle: targeted tumor pre-RFA white arrow: necrotic zone, red arrow: residual tumor). Red and blue represent high or low fluorescence intensity (n = 3).

