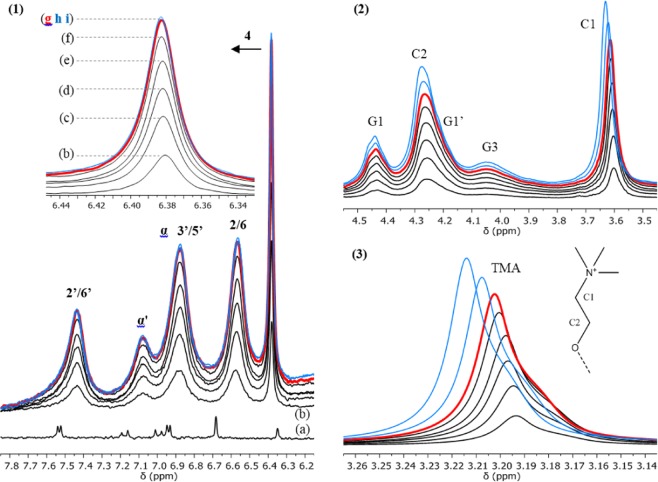
Figure 6.
Titration of an excess of solid RSV in D2O by plain P90G liposomes. Regions of the 1H NMR spectra recorded (a) in the absence of P90G liposomes and (b–i), at the same scale, after mixing with increasing amounts of P90G liposomes (300 K, 500 MHz). (1) Region showing the signals of RSV. (2–3) Regions showing the signals C2, C1 and TMA of the choline head group of P90G. The sample used to acquire spectrum (a) comprised 500 µL of D2O and about 1 mg of RSV, which was mainly undissolved. Spectra (b–i) were recorded after repeated additions of 40 µL aliquots of a 100 mg/mL dispersion of plain P90G liposomes, up to a total addition of 320 µL; these spectra are superimposed without vertical offset. Spectrum (g) in red was recorded after a total addition of 240 µL; the two subsequent spectra (h – 280 µL and i – 320 µL) are in blue.

