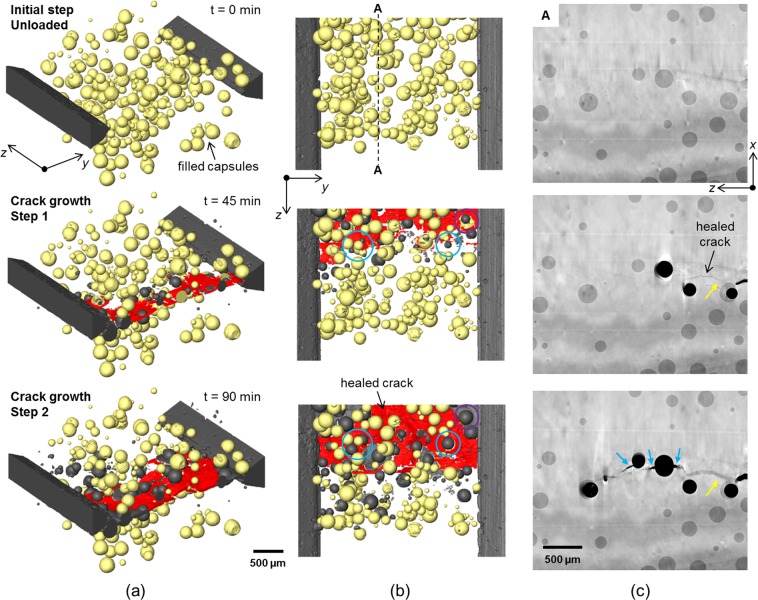
Figure 3.
Tracking capsule activation, release of solvent and crack healing during propagation of the crack. (a) 3D perspective and (b) plan views of 3D surface renderings of the region of interest (2.2 × 3.4 × 2.7 mm3 (x, y, z)) showing the self-healing epoxy sample at several states during progressive loading to grow a crack. The matrix is rendered transparent, the filled capsules shown in yellow, empty capsules/crack in grey and the filled/healed crack in red. (c) 2D virtual greyscale slices intersecting the sample (and crack) at the location indicated ‘A’. The same equivalent slice is shown for each crack growth step. The black regions correspond to unfilled crack/capsules. The direction of crack growth is along ‘z’ (right to left). The time stated for each step represents the approximate time accumulated since the scan for the initial unloaded step was started.

