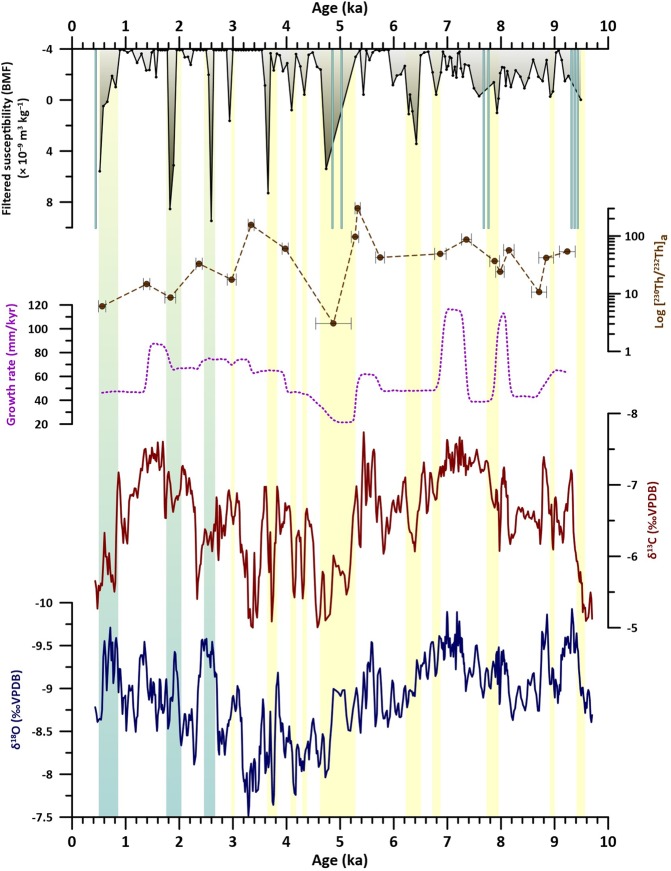
Figure 2.
RMD1 proxies vs. age. From bottom: δ18O; δ13C, growth rate; [230Th/232Th] for the dated points; filtered mass magnetic susceptibility (χ) series representing the background magnetic flux (BMF, see text for details), light-blue bars are the χ peaks >12 m3 kg−1 indicating the spikes of coarser material. Rectangles indicate the spikes in BMF, yellow: spikes characterized by a similar behaviour of δ13C and δ18O; blue: intervals where δ13C and δ18O show an opposite pattern.

