Figure 1.
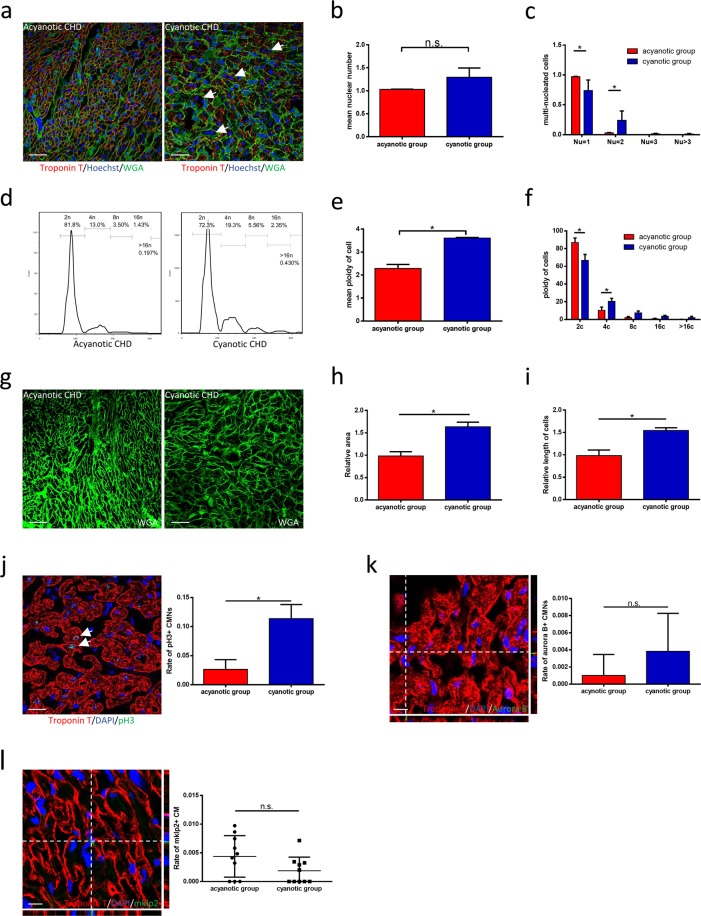
Ploidy and nuclear number of cardiomyocytes is higher in cyanotic congenital heart disease. (a) Representative immunofluorescence image of multinucleated cardiomyocytes in acyanotic and cyanotic congenital heart disease. Scale bars, 50 μm. (b) The mean nuclear number of cardiomyocytes in both acyanotic and cyanotic group (n = 3 each). (c) The percent of multinucleated cardiomyocytes between acyanotic and cyanotic group (n = 3 each). (d) Representative distribution of ploidy of cardiomyocytes. (e) The mean ploidy of cardiomyocytes (n = 3 each). (f) The percent of polyploid cardiomyocytes between acyanotic and cyanotic group (n = 3 each). (g) Representative WGA staining in both acyanotic and cyanotic group. Scale bars, 50 μm. (h) The result of relative area of cardiomyocytes (n = 5 each). (i) The relative length of cardiomyocytes (n = 5 each). (j) Co-immunostaining with anti-pH3 and anti-cTnT antibodies. Results are displayed as a presentative image (left, scale bars, 25 μm) and as a bar chart (right, n = 6 each). (k) Co-immunostaining with anti-Aurora B and anti-cTnT antibodies. Results are displayed as a representative image (left, scale bars, 10 μm) and as a bar chart (right, n = 6 each). (l) Co-immunostaining with anti-mklp2 and anti-cTnT antibodies. Results are displayed as a representative image (left, scale bars, 10 μm) and as a chart (right, n = 10 each). Data is presented as mean ± s.d. *P < 0.05.

