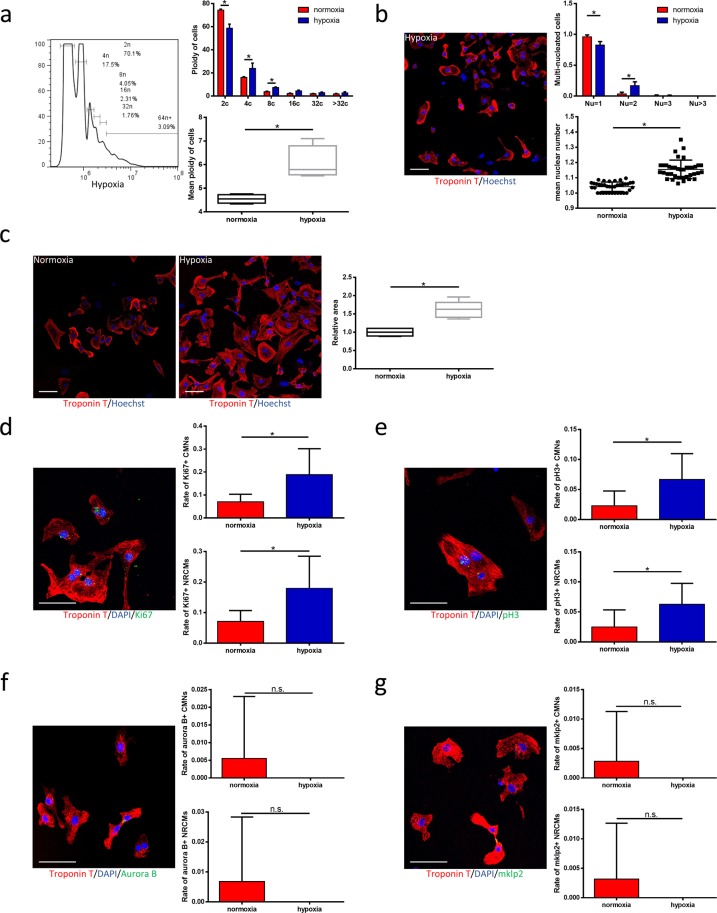
Figure 3.
Hypoxia forces CMs to enter an incomplete cell cycle and thus increases ploidy and nuclear numbers in vitro. (a) Distribution of ploidy of neonatal rat cardiomyocytes (NRCM). Results are displayed as a representative hypoxic cardiomyocytes (left), as a bar chart of ploidy of cardiomyocytes (upper right, n = 4 samples each) and as a box plot of mean ploidy of cardiomyocytes (lower right, n = 4 samples each). (b) The nuclear number of NRCMs. Results are displayed as a representative hypoxic image (left, scale bars, 50 μm), as a bar chart of multinucleated cardiomyocytes (upper right, n = 37 samples for normoxia, n = 28 samples for hypoxia, >30 cardiomyocytes from 9 randomly chosen fields were counted for each individual sample) and as a chart for mean nuclear number (lower right). (c) Immunofluorescence with anti-cTnT in both normoxic and hypoxic group. Results are displayed as two representative images (left, scale bars, 50 μm) and as a box plot (right, n = 5 samples each, >30 cardiomyocytes from 9 randomly chosen fields were counted for each individual sample). (d) Co-immunostaining with anti-Ki67 and anti-cTnT antibodies. Results are displayed as a presentative image (left, scale bars, 100 μm), as two bar charts of Ki67-positive cardiomyocyte nuclei (upper right, n = 6 samples each, >30 cardiomyocytes from 9 randomly chosen fields were counted for each individual sample) and Ki67-positive cardiomyocytes (lower right, n = 6 samples each, >30 cardiomyocytes from 9 randomly chosen fields were counted for each individual sample). (e) Co-immunostaining with anti-pH3 and anti-cTnT antibodies. Results are displayed as a presentative image (left, scale bars, 100 μm), as two bar charts of pH3-positive cardiomyocyte nuclei (upper right, n = 9 samples each, >30 cardiomyocytes from 9 randomly chosen fields were counted for each individual sample) and pH3-positive cardiomyocytes (lower right, n = 8 samples each, >30 cardiomyocytes from 9 randomly chosen fields were counted for each individual sample). (f) Co-immunostaining with anti-Aurora B and anti-cTnT antibodies. Results are displayed as a representative image (left, scale bars, 100 μm), as two bar charts of Aurora B-positive cardiomyocyte nuclei (upper right, n = 21 samples each, >30 cardiomyocytes from 9 randomly chosen fields were counted for each individual sample) and Aurora B-positive cardiomyocytes (lower right, n = 21 samples each, >30 cardiomyocytes from 9 randomly chosen fields were counted for each individual sample). (g) Co-immunostaining with anti-mklp2 and anti-cTnT antibodies. Results are displayed as a representative image (left, scale bars, 100 μm), as two bar charts of mklp2-positive cardiomyocyte nuclei (upper right, n = 19 samples each, >30 cardiomyocytes from 9 randomly chosen fields were counted for each individual sample) and mklp2-positive cardiomyocytes (lower right, n = 19 samples each, >30 cardiomyocytes from 9 randomly chosen fields were counted for each individual sample). Data is presented as mean ± s.d. *P < 0.05.

