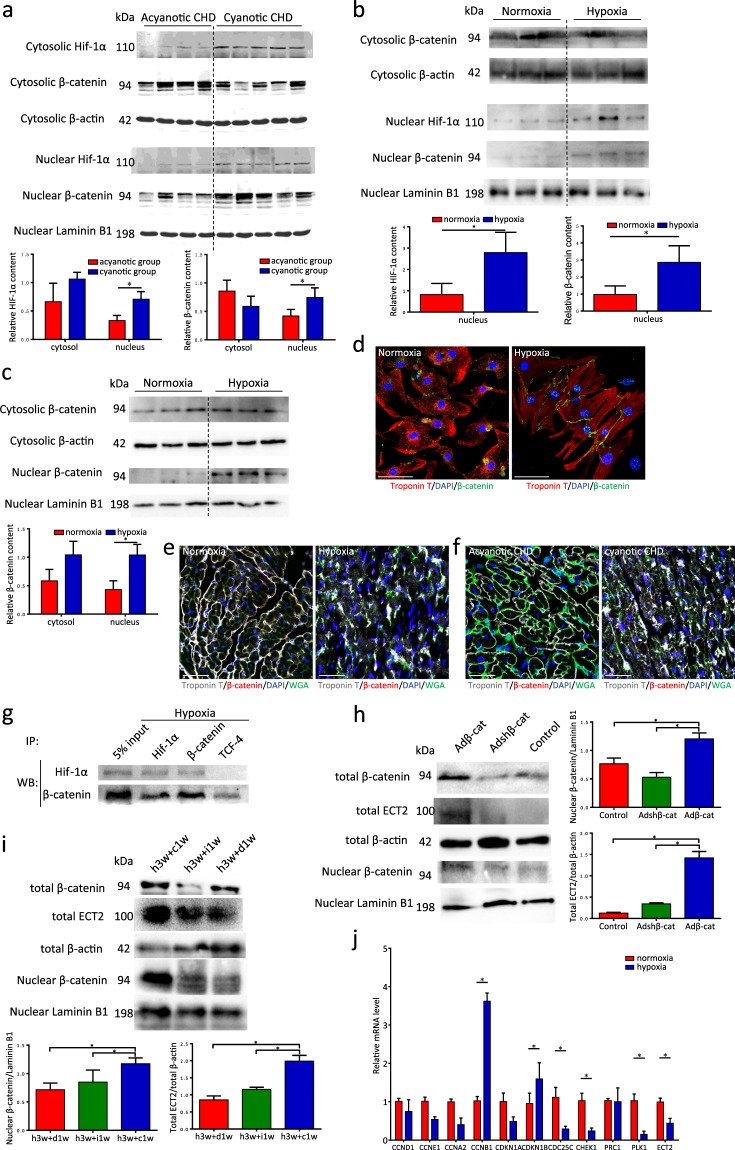
Figure 5.
β-catenin is inactive under hypoxia condition. (a) Western blot analysis for HIF-1α and β-catenin in nucleus and cytosol in both acyanotic and cyanotic group (n = 4 for acyanotic group, n = 5 for cyanotic group). (b) Western blot analysis for HIF-1α and β-catenin in nucleus and cytosol in both mice groups (n = 3 each). (c) Western blot analysis for β-catenin in nucleus and cytosol in both NRCM groups (n = 3 sample each). (d) Co-immunofluorescence with anti-β-catenin and anti-cTnT antibodies in both NRCM groups. Scale bars, 50 μm. (e) Co-immunofluorescence with anti-β-catenin, anti-cTnT antibodies and anti-WGA in both mice groups. Scale bars, 50 μm. (f) Co-immunofluorescence with anti-β-catenin, anti-cTnT antibodies and anti-WGA in both acyanotic CHD and cyanotic CHD groups. Scale bars, 50 μm. (g) Co-immunoprecipitation for β-catenin, TCF4 and Hif-1. (h) Western blot analysis for β-catenin in nucleus and total protein and ECT2 in total protein of NRCMs (n = 3 each). (i) Western blot analysis for β-catenin in nucleus and total protein and ECT2 in total protein of mice model (n = 3 each). (j) qPCR analysis of cell cycle and cytokinesis genes normalized to actin (n = 3 each). Data is presented as mean ± s.d. *P < 0.05.

