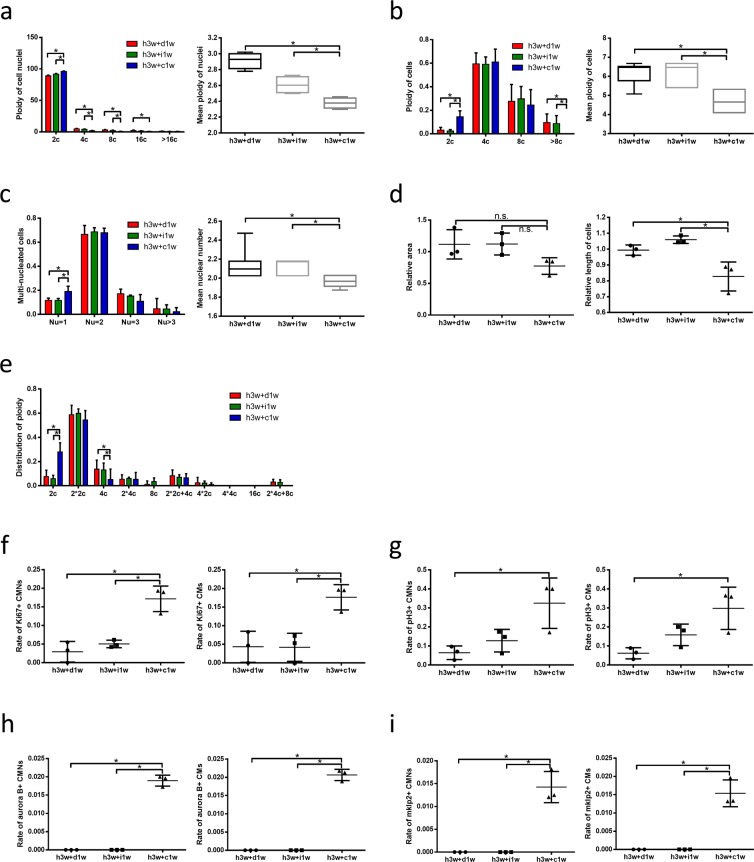
Figure 7.
Active β-catenin reduce ploidy and nuclear number of cardiomyocytes in vivo. (a) Distribution of ploidy (left, n = 4 each) and mean ploidy (right, n = 4 each) of cardiomyocyte nuclei via flow cytometry. (b) Distribution of ploidy (left, n = 4 each) and mean ploidy (right, n = 4 each) of cardiomyocytes. (c) Distribution of ploidy (left, n = 15 each) and mean ploidy (right, n = 15 each) of cardiomyocytes. (d) Relative area (left, n = 3 each) and relative length (right, n = 3 each) of cardiomyocytes. (e) Distribution of cardiomyocyte ploidy (n = 3 each). (f) The percent of Ki67-positive cardiomyocyte nuclei (left, n = 3 each) and Ki67-positive cardiomyocytes (right, n = 3 each). (g) The percent of pH3-positive cardiomyocyte nuclei (left, n = 3 each) and pH3-positive cardiomyocytes (right, n = 3 each). (h) The percent of Aurora B-positive cardiomyocyte nuclei (left, n = 3 each) and Aurora B-positive cardiomyocytes (lower right, n = 3 each). (i) The percent of mklp2-positive cardiomyocyte nuclei (upper right, n = 3 each) and mklp2-positive cardiomyocytes (lower right, n = 3 each). Data is presented as mean ± s.d. *P < 0.05.

