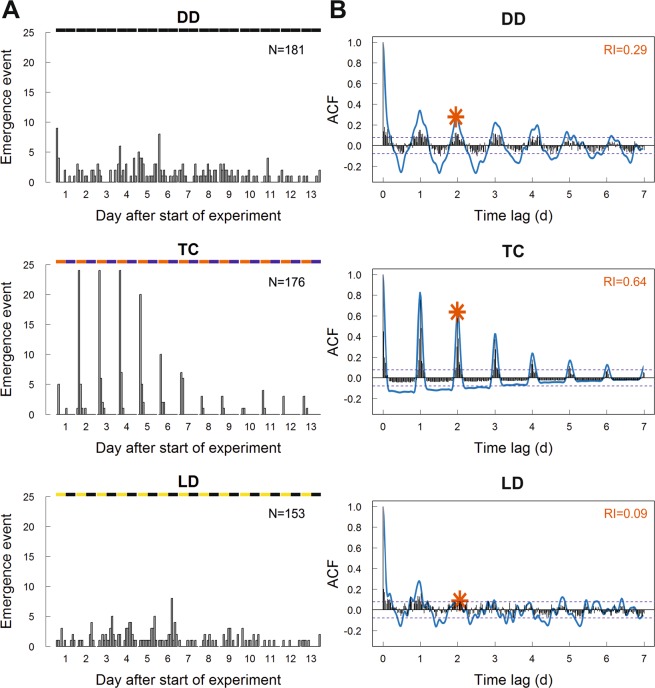
Figure 1.
Analysis of rhythmicity in emergence under different environmental conditions. Separate graphs are shown for the treatments constant darkness (DD), temperature cycles (TC) and light-dark cycles (LD). Shown are the raw data of the emergence events throughout 13 days, plotted with a time bin of 2 hours (A), and the associated autocorrelation function (ACF) for the emergence events plotted with a time bin of 30 minutes (black bars), the 10% confidence interval (blue dotted line), the smoothed autocorrelation function (blue graph) and the rhythmicity index (RI, marked by the red asterisk) (B). The RI indicates rhythmicity strength (RI > 0.3 = highly significant, 0.1 < RI < 0.3 = significant, RI < 0.1 = not significant). X-axis shows the time lag between correlated emergence events. Daily rhythms of emergence are indicated by the autocorrelation function peaking above the confidence interval several times every approximately 24 h. Illumination bars on top of graphs in (A) depict the light regime in the different treatments (black: darkness, red: high temperature (25 °C), blue: low temperature (15 °C), yellow: light). Constant temperature in DD and LD, constant darkness in TC.

