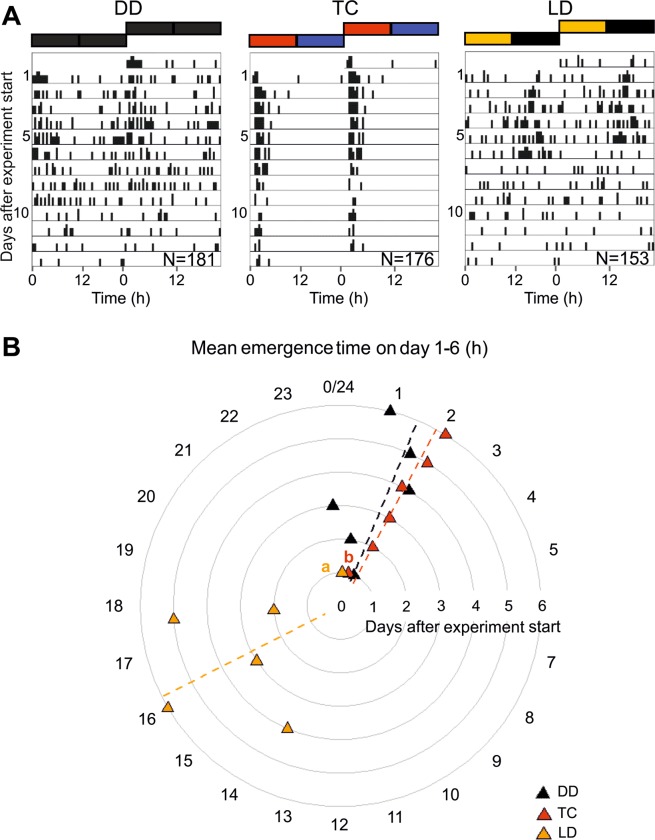
Figure 2.
Comparison of emergence period and emergence activity patterns under different environmental conditions. (A) Double plotted emergence actograms of test bees in constant conditions (DD), with temperature cycles (TC) and light-dark cycles (LD). Emergence events in actograms are plotted in data bins of 30 minutes for the days 1 to 13 after experiment start and environmental bars depict the different conditions of the treatments (black/black: constant conditions; red/blue: 12 h high temperature/12 h low temperature; yellow/black: 12 h light/12 h darkness). (B) shows the mean phases of emergence events on day 1–6 (triangles) and the mean emergence phase over all six days (dotted lines) for the different treatments (DD, TC, LD), which indicate a differential phase relationship for LD compared to the other treatments. Circular axis: “time of the day” after experiment onset. Watson U2 test provides significant difference in emergence phase distribution on day 1 between treatments TC and LD.

