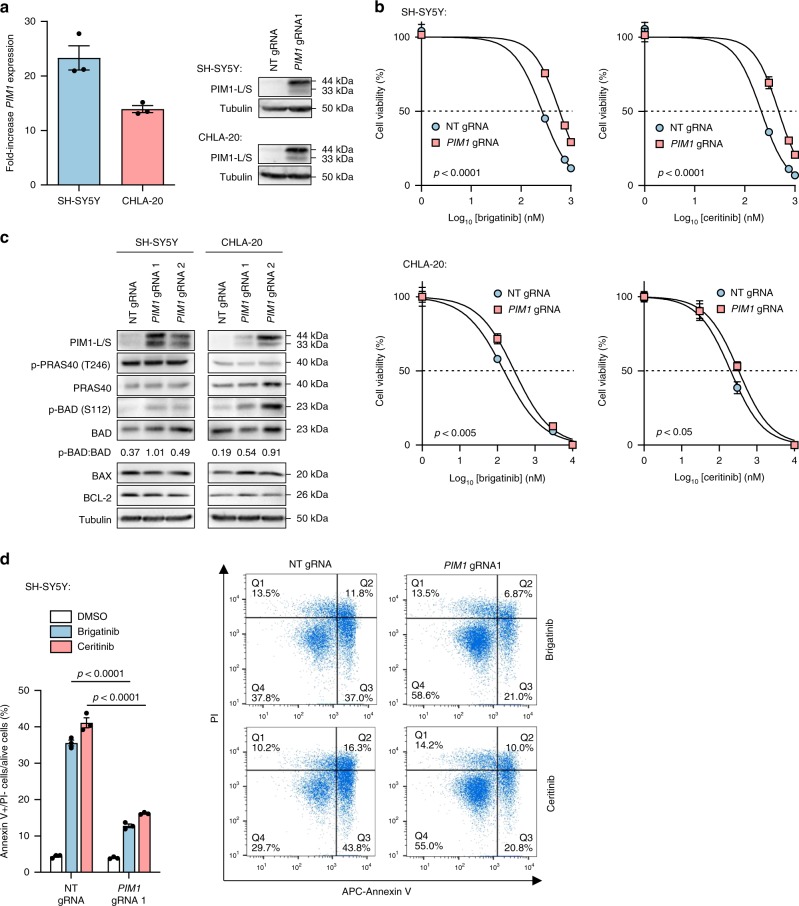
Fig. 2.
PIM1 inhibits apoptosis through phosphorylation of BAD. a Expression of PIM1 in SH-SY5Y or CHLA-20 cells transduced with non-targeting (NT) or PIM1-targeting gRNA molecules, by RT-qPCR and immunoblot. RT-qPCR data were normalized to cells treated with non-targeting gRNA and show means ± s.d. of triplicate experiments. b 72-h dose–response assays of brigatinib or ceritinib-exposed SH-SY5Y or CHLA-20 cells transduced with NT or PIM1-targeting gRNA. Data points represent means ± s.d. of triplicate experiments. ED50 values were compared by an unpaired Student’s t-test. c Immunoblot of known PIM1 targets and apoptotic mediators in SH-SY5Y and CHLA-20 cells transduced with NT- or PIM1-targeting gRNA, the latter leading to PIM1 overexpression. Data are representative of three independent experiments. Numbers below the blot represent the densitometric measurement of pBAD levels normalized to BAD. d Percentage of apoptotic (annexin V + /PI-) PIM1-overexpressing SH-SY5Y cells after 48-h of treatment with 1 µM brigatinib or ceritinib. Data points in the bar chart show means ± s.d. of triplicate experiments. p-values were calculated using an unpaired Student’s t-test. Source data for this figure are provided as a Source Data file.

