Fig. 4.
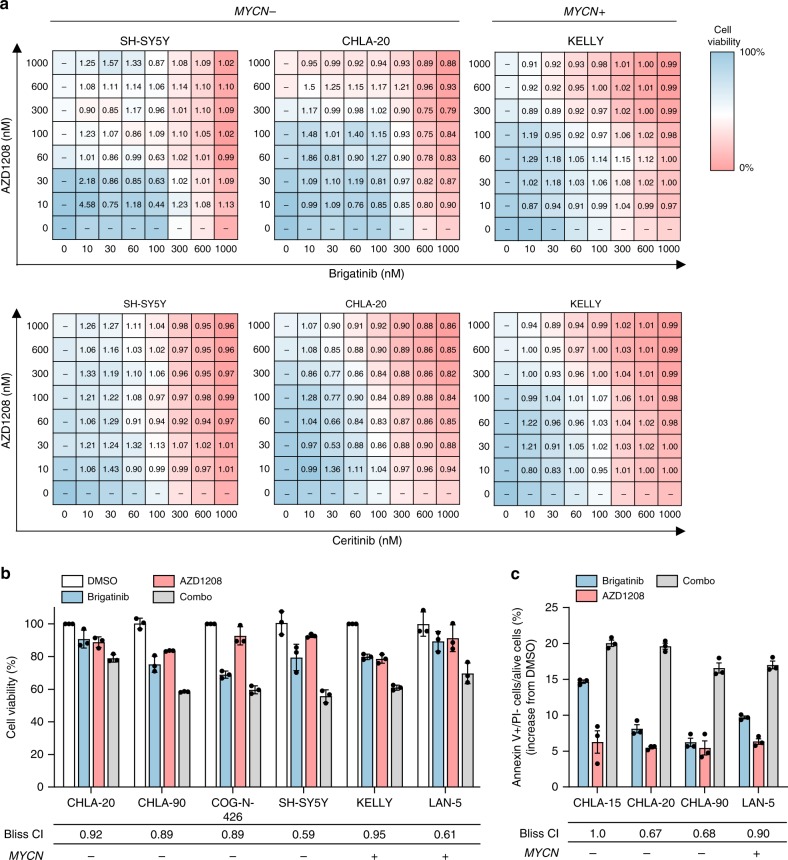
ALK and PIM inhibitors exhibit mild synergism in ALK-positive NB cell lines. a Dose–response matrices of brigatinib vs. AZD1208 and ceritinib vs. AZD1208 in SH-SY5Y, CHLA-20, and KELLY cell lines. Heat maps visually represent inhibition of cell viability after 72 h of treatment, and numbers indicate Bliss combination index (CI) values for each dose pair. Data points are representative of two independent experiments. b Assessment of the interaction between brigatinib and AZD1208 in a panel of ALK-positive NB cell lines using the Bliss Independence model. CI < 1 indicates synergism, CI = 1 indicates additivity and CI > 1 indicates antagonism. Data points represent means ± s.d. of triplicate experiments. Brigatinib was used at the approximate ED10 concentration for each cell line ED10 (CHLA-20) = 30 nM; ED10 (CHLA-90) = 30 nM, ED10 (COG-N-426) = 30 nM, ED10 (SH-SY5Y) = 30 nM, ED10 (KELLY) = 30 nM, ED10 (LAN-5) = 3 nM). c Apoptosis analysis of ALK-positive NB cell lines treated with DMSO, brigatinib (1 µM), AZD1208 (1 µM), or a combination of the two (combo) for 48 h. Drug interaction was assessed using the Bliss Independence model, as described above. Data points represent means ± s.d. of triplicate experiments. Source data for this figure are provided as a Source Data file.

