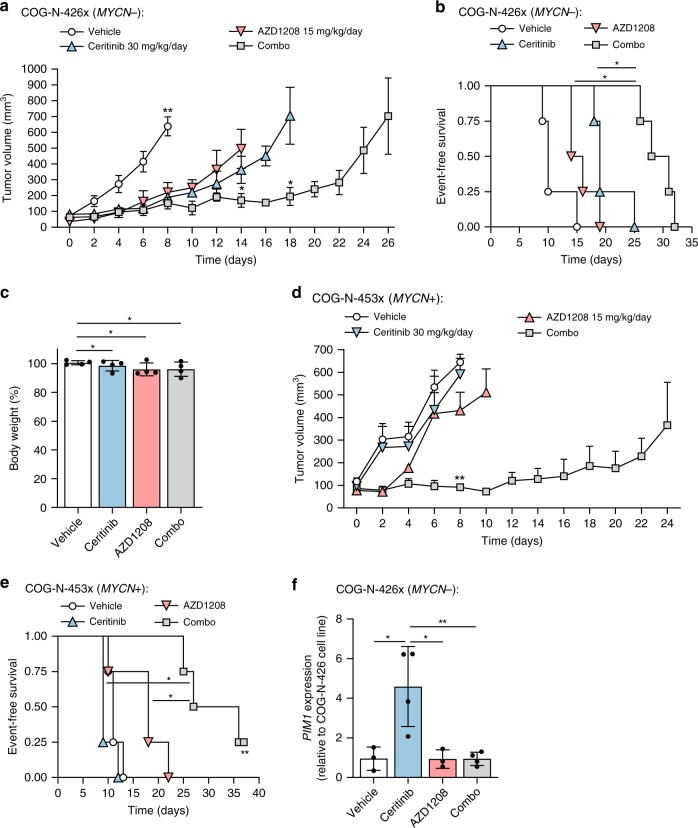
Fig. 5.
Efficacy of ceritinib and AZD1208 in driven patient-derived NB xenografts. a Tumor volume over time in COG-N-426x PDX mice administered daily with vehicle (0.5% hydroxypropyl methylcellulose, 0.5% Tween-80), ceritinib (30 mg/kg), AZD1208 (15 mg/kg), or ceritinib and AZD1208 (combo). Data points represent means (n = 4) ± s.e.m. and are shown until death of the first animal within each treatment group. *p < 0.05; **p < 0.005 (Mann–Whitney test). b Kaplan–Meier event-free survival according to each treatment group for tumor-bearing COG-N-426x mice, where survival is defined as the time taken for tumors to reach 15 mm diameter. *p < 0.01 (Log-rank test). c COG-N-426x mouse body weight at the experiment end-point relative to baseline per treatment group. Data points represent means (n = 4) ± s.d. *p > 0.05 (unpaired Student’s t-test). d Tumor volume over time for COG-N-453x PDX mice administered daily with vehicle (0.5% hydroxypropyl methylcellulose, 0.5% Tween-80), ceritinib (30 mg/kg), AZD1208 (15 mg/kg), or ceritinib and AZD1208 (combo). Data points represent means (n = 4) + s.e.m. and are shown until death of the first animal within each treatment group. **p < 0.005 (Mann–Whitney test). e Kaplan–Meier survival curve per treatment group for tumor-bearing COG-N-453x mice, where survival is defined as the time taken for tumors to reach 15 mm diameter. The study was terminated on day 37, thus censoring one mouse (**). *p < 0.01 (Log-rank test). f PIM1 mRNA levels at the experimental end-point for COG-N-426x tumor-bearing mice per treatment group. Data points represent means (n = 4) ± s.d. of triplicate experiments, *p < 0.05; **p < 0.01 (unpaired Student’s t-test). Source data for this figure are provided as a Source Data file.

