Fig. 1.
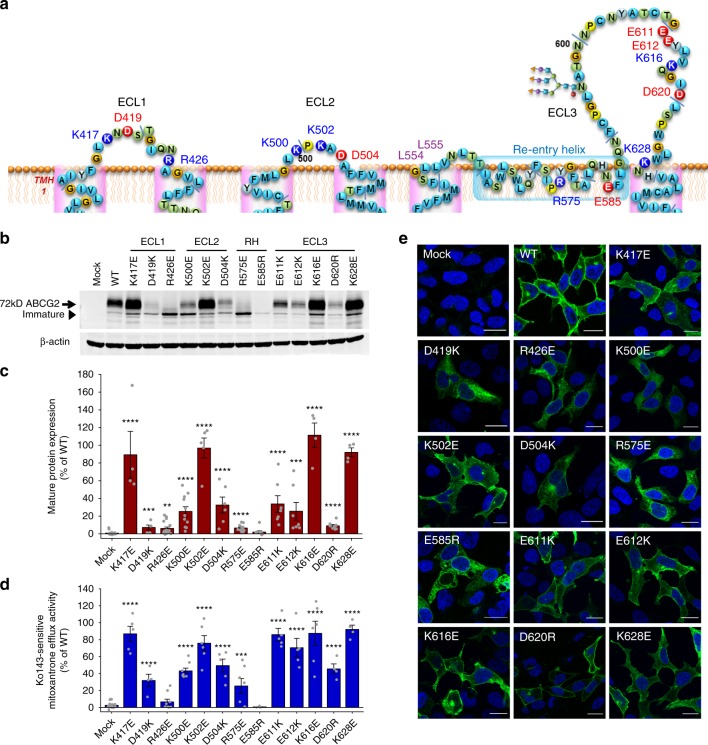
Charged residues in the extracellular roof are critical for ABCG2 function. Mutational analysis of residues in the putative extracellular membrane interface. Charged residues located in the ECL1, ECL2, re-entry helix, and ECL3 were subjected to mutational analysis: a Predicted membrane topology of extracellular regions in the human ABCG2 transporter. Re-entry helix is highlighted in light blue box; consensus glycosylation site is at N596. Residues subjected to mutagenesis are indicated; positively charged residues (blue); negatively charged residues (red). b Immunodetection of ABCG2 mutant variants using the monoclonal anti-ABCG2 (BXP-21) antibody. Mature wild-type (WT) protein migrates at ~72 kDa, the immature unglycosylated bands migrate just below. β-Actin was used as an internal loading control. c Odyssey-based quantification of immunoblots from several independent experiments (n = 3–15). Mature ABCG2 and β-actin bands are shown, and ABCG2 signals were individually normalized to β-actin and represented as the percentage of WT control. d Mitoxantrone efflux is shown for HEK293 cells expressing ABCG2 variants after incubation at 37 °C for 20 min in the presence and absence of the ABCG2 inhibitor Ko143. Ko143-sensitive mitoxantrone efflux is represented as percentage relative to the WT control. Data are from several independent experiments (n = 3–9). All data are shown as means ± SEM. ****P < 0.0001; ***P < 0.001; **P < 0.01; *P < 0.1 vs. empty plasmid-transfected HEK293 control (mock). Gray dots refer to values from each independent experiment. e Membrane localization of GFP-tagged ABCG2 variants. GFP signals of GFP-ABCG2 (green) were recorded in a confocal microscopy as described in Methods. DAPI was used to stain the nuclei (blue). Microscopy data are from duplicate experiments. Scale bars in microscopy images correspond to 20 µm.

