Fig. 4.
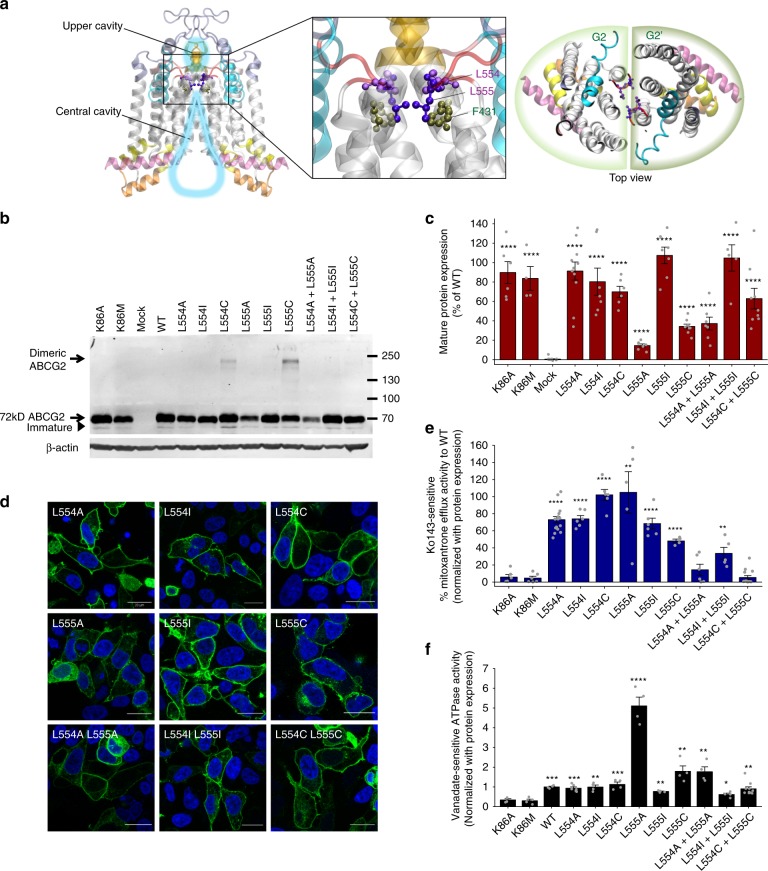
The di-leucine motif at the top of the central cavity is critical for ABCG2 function. a Ribbon representation of homo-dimeric ABCG2 in the ATP-free state. The zoom-in view shows the positions of L554 and L555 (purple balls-and-sticks) subtending the extracellular membrane border between the central and upper cavities. F431 (dark green balls-and-sticks) locates just below the di-leucine valve. b Immunodetection is shown for ABCG2 variants stably expressed in HEK293 cells and detected by the anti-ABCG2 (BXP-21) antibody. ABCG2 monomers migrate at ~72 kDa, while dimeric ABCG2 is located above. β-Actin was used as an internal loading control. c Odyssey-based quantification of stably expressed ABCG2 variant, normalized against WT ABCG2, is plotted. Data are from several independent experiments (n = 3–13). All results are represented as means ± SEM; ****P < 0.0001 vs. mock control. Gray dots represent values from independent biological replicates. d Membrane localizations of GFP-tagged ABCG2 variants (green) are shown. Nuclear DNA was stained with DAPI (blue). Microscopy data are from duplicate experiments. Scale bars in microscopy images correspond to 20 µm. e Normalized mitoxantrone efflux activity of di-leucine valve mutants is plotted. Ko143-sensitive efflux activity is given as percentage activity of the WT control (n = 4–18). Bar graphs are shown as means ± SEM; ****P < 0.0001; **P < 0.01 vs. K86M. Gray dots represent values from independent biological replicates. f Vanadate-sensitive ATPase activities of ABCG2 variants stably expressed in HEK293 cells are quantified. Data are from independent experiments (n = 4–10), using three different batches of membrane preparations. Double mutation L554C L555C samples were prepared from four clones of stable cell line. Data are normalized and given as fold changes relative to WT. All data are means ± SEM; ****P < 0.0001; ***P < 0.001; **P < 0.01; *P < 0.1 vs. negative control. Gray dots represent values from independent biological replicates.

