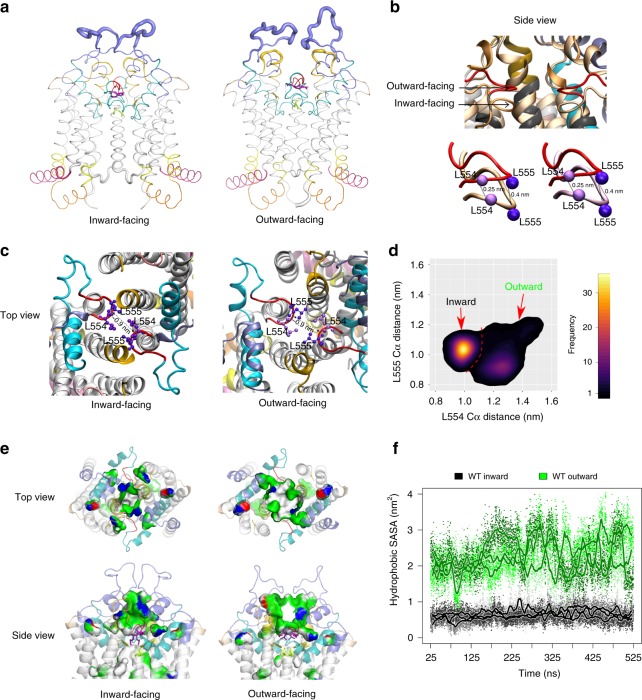
Fig. 6.
Conformational dynamics between inward- and outward-facing states. a MD simulations reveal conformational dynamics of the inward- and outward-facing states, quantified as root mean square fluctuations (RMSFs), and averaged over the three independent replicates. The results were highlighted in the structure by adapting the thickness of the respective backbone sections. The elbow helix (pink) followed by TMH1–6 helices (gray), cytoplasmic distal TMH2, and the TMH3 helical part (yellow), ECL1 (golden), ECL2 (old rose), the short loop after TMH5 (red), the re-entry helix (cyan), and the large extracellular ECL3 (violet). b The zoom-in side views show the overlay of the di-leucine valve between inward- (pale orange) and outward-facing (red) states. The Cα atoms of leucine 554 and 555 are in pale and dark purple balls, respectively. c The top view at the di-leucine valve of both states. Dotted lines indicate the distance in nm. d Di-leucine valve distance probability plots, averaged over the three independent simulations of outward and inward-facing ABCG2. e Expansion of the upper cavity. Slice through the upper cavity of the inward-facing and the outward-facing structures showing the polarity of cavity-facing color-coded residues; white (hydrophobic), green (polar), blue (positive charge), and red (negative charge). f Quantification of the solvent-exposed hydrophobic surface area (SASA) in the upper cavity. Data were obtained from three independent parallel MD simulations of 500 ns for WT in the inward- and outward-open conformations, with 10 ps sampling rate (small dots) and smoothened with a running average of 1 ns (thick line).

