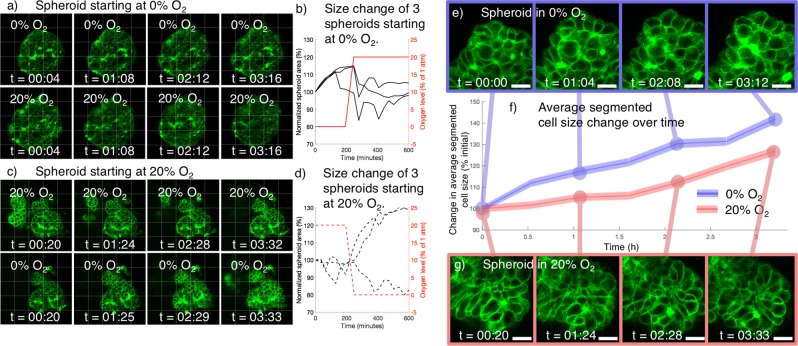
Figure 3.
Two-photon monitoring of tumour spheroid membrane stain during on-chip exposure to 0% and 20% O2 shows spheroid swelling without disaggregation, as well as greater individual cell size increase under 0% O2. (a) Two-photon Z-slices of a representative spheroid starting at 0% O2 (top row) and switched to 20% O2 (bottom row) after 224 minutes. (b) Quantified spheroid swelling behaviour (via segmented transmitted light spheroid area) of spheroids starting at 0% O2 and switched to 20% O2 during monitoring. 3 of 3 spheroids increased in size during exposure to 0% O2 and ceased swelling after switching to 20% O2. (c) two-photon Z-slices of a representative spheroid starting at 20% O2 (top row) and switched to 0% O2 (bottom row) after 224 minutes. (d) Quantified spheroid swelling behaviour (via segmented transmitted light spheroid area) of spheroids starting at 20% O2 and switched to 0% O2 during monitoring. None of the spheroids swelled during exposure to 20% O2, and 2 of 3 spheroids swelled after switching to 0% O2. All times overlaid upon images indicate time in the current gas condition. 50 × 50 μm grid is superimposed in (a–c) to aid visualization of size changes. (e) Portion of a spheroid exposed to 0% O2 at varying times after initiating on-chip gas control. Gaps do not appear to form between the cells, despite spheroid swelling. (f) Plot of average cell size change over time, from segmented individual cells within spheroids exposed to 0% and 20% O2 during two-photon monitoring. Shaded coloured region denotes the standard error of the mean of all of the segmented cells in N = 3 spheroids under each condition. 1300–3200 total cells were measured at each time point for each condition to analyse the average cell size change. A Mann-Whitney U-test indicated a significant difference between the cell size distributions for the spheroids at 0% and 20% oxygen (p < 1 × 10⁻⁴) for all 6 timepoints t > 0. (g) Portion of a spheroid exposed to 0% oxygen at varying time points after initiating on-chip gas control. Scale bars on (e–g) depict 20 μm.

