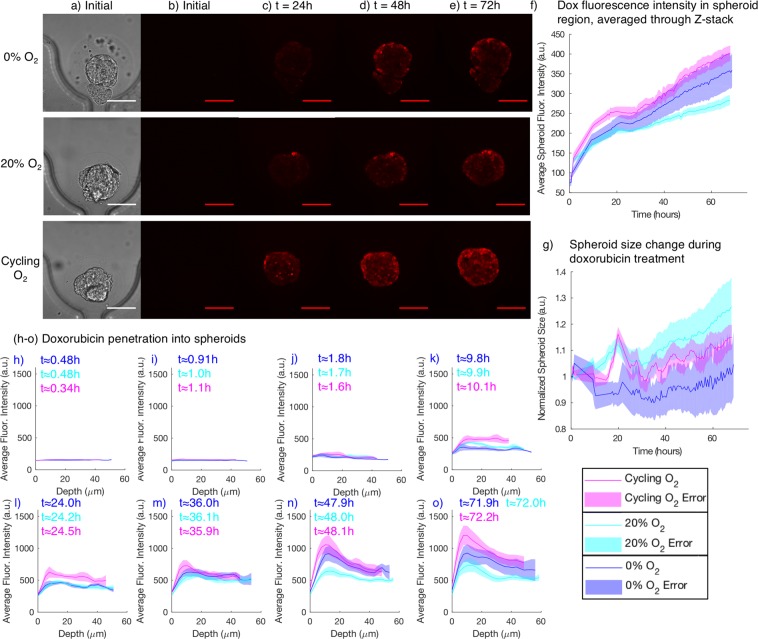
Figure 4.
Monitoring doxorubicin (dox) accumulation and spheroid size change during treatment under in vitro normoxia (20% O2), chronic severe hypoxia (0% O2), and cycling hypoxia (cycling gas profile with 4 h 0%, 4 h 20% O2). (a) Example transmitted light images used for spheroid segmentation. (b) Doxorubicin fluorescence at the beginning of the experiment, prior to starting the doxorubicin flow. Almost no fluorescence is visible. (c–e) Two-photon doxorubicin fluorescence images after 24, 48, and 72 h of doxorubicin treatment. (f) Quantified average doxorubicin fluorescence intensity in the spheroid region (the total summed pixel intensity in the segmented region divided by its pixel area). (g) Quantified segmented spheroid area change during the 72 h treatment, for spheroids in each of the tested oxygen conditions. Doxorubicin accumulation is higher under cycling hypoxia than under chronic severe hypoxia and normoxia. (h–o) Doxorubicin penetration, visualized as average doxorubicin fluorescence intensity vs. depth into the spheroid, for different oxygen conditions, at varying times in the experiment. Imaging the complete set of spheroids in all three conditions took ~30 minutes, so the average time for each set of images of each condition is reported. Issues with the microscope stage automation reduced temporal resolution over the first ~24 h of the experiment. Shaded regions depict standard error of the mean for N = 5 (cycling), 6 (20%), 4 (0%) spheroids.

