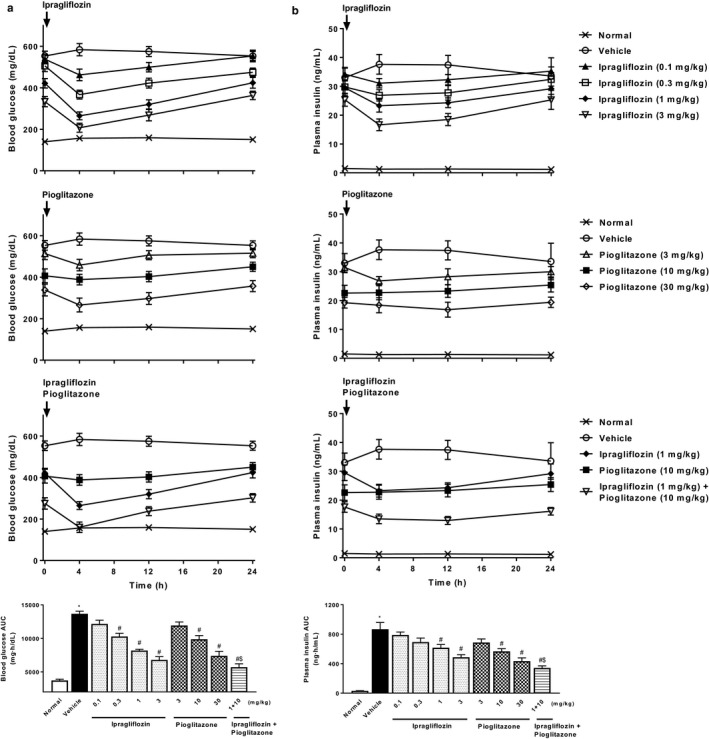
Figure 1.

Effects of single or combined treatment with ipragliflozin and pioglitazone on blood glucose and plasma insulin levels in type 2 diabetic mice with NASH. Time course of changes in (a) blood glucose and (b) plasma insulin levels, and the area under the blood glucose and plasma insulin concentration–time curve (AUC) for 24 hr. Blood glucose and plasma insulin levels were measured at Week 2 of repeated administration. Values indicate mean ± SEM for six animals per group. *p < .05 versus normal group, # p < .05 versus vehicle group, $ p < .05 versus pioglitazone (10 mg/kg) group
