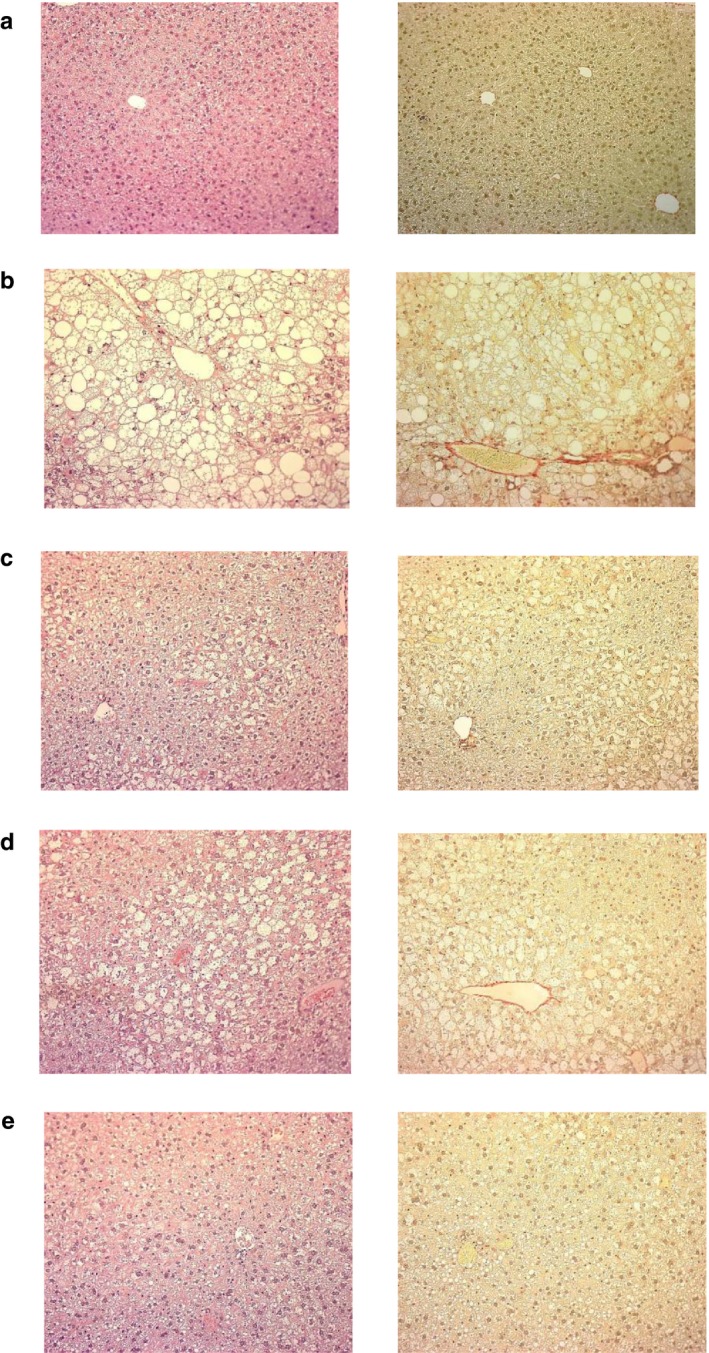
Figure 4.

Representative light micrographs of liver tissue obtained from (a) normal, (b) vehicle‐treated, (c) ipragliflozin (1 mg/kg)‐treated, (d) pioglitazone (10 mg/kg)‐treated, and (e) ipragliflozin (1 mg/kg) + pioglitazone (10 mg/kg)‐treated type 2 diabetic mice with NASH. Ipragliflozin and/or pioglitazone was orally administered to diabetic mice with NASH for 4 weeks. The tissues were stained with hematoxylin and eosin (left) and sirius red (right). Magnification: ×100
