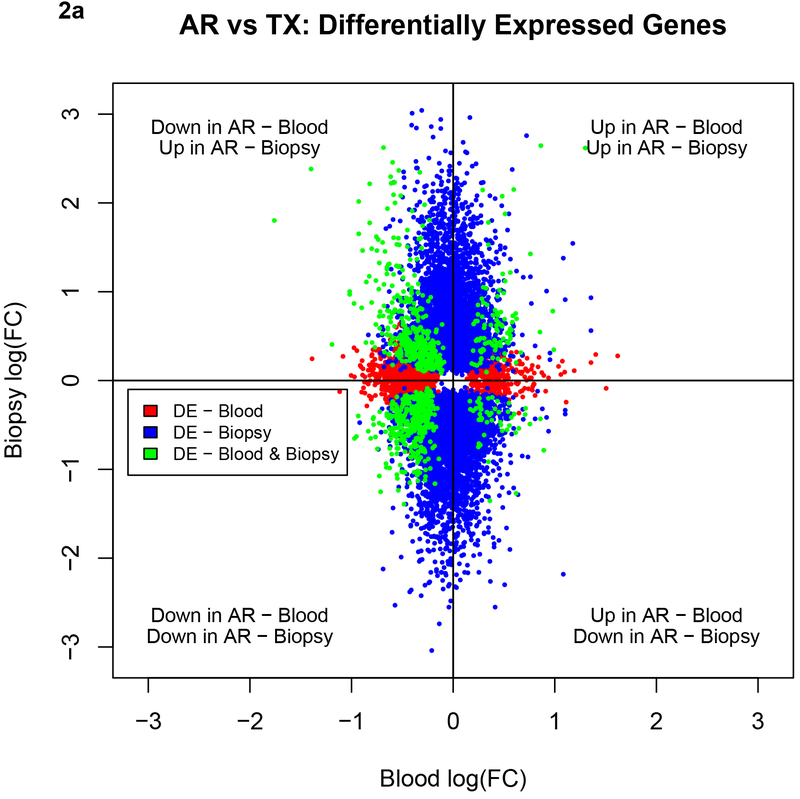
Figure 2a.
Comparison of the directionality of fold changes for AR vs. TX among shared genes and DEGs in the blood and biopsies by microarrays. Blue dots denote DEGs in biopsies, red dots denote DEGs in blood and green dots shared genes between biopsies and blood. Acute Rejection; DEG, differentially expressed genes; TX, transplant excellent.

