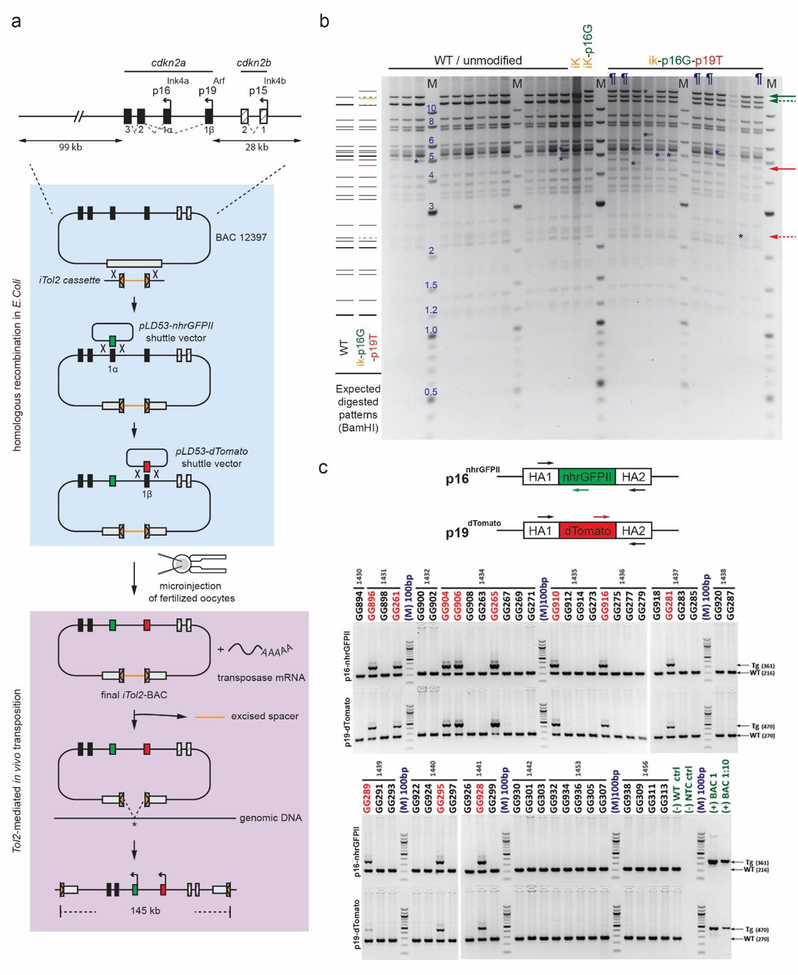
Figure 1.
Design, generation, and verification of the Cdkn2a reporter BAC construct. a Schematic diagram displays mouse Cdkn2a gene locus (top), BAC modification steps by homologous recombination (middle), and transposase-aided integration (bottom). The pBeloBAC11 vector backbone is indicated by the gray box in middle and bottom panels. b Photo of representative, ethidium bromide-stained agarose gel of unmodified (WT) and modified BAC cDNA following BamHI digestion. Expected restriction fragments (left) and fragment sizes (M; middle) are displayed in kilobases. Yellow, green, and red lines and arrows show new fragments expected after iTol2, p16-nhrGFPII, and p19-dTomato insertion, respectively. Dashed arrows identify loss of unmodified wildtype bands; solid arrows indicate expected transgene insertion bands. Definitions - iK: iTol2-inserted BAC; ik-p16G: iTol2 and p16-nhrGFPII-inserted BAC; ik-p16G-p19T: iTol2, p16-nhrGFPII and p19-dTomato-inserted BAC; ¶: confirmed BACik-p16G-p19T clones; *, unexpected restriction fragment. c Photo of representative, ethidium bromide-stained agarose gel showing PCR products resulting from amplification of genomic DNA from individual BAC transgenic founders. Schematic diagram (top panel) shows location of PCR primers to amplify either wildtype (WT) or transgenic (TG) DNA for p16-nhrGFPII and p19-dTomato. Arrows (right side) indicate expected PCR product sizes. Molecular weight (M) is indicated in nucleotide base pairs (bp). Definition - HA: Homology Box A represents the sequence flanking transgene insertion site.

