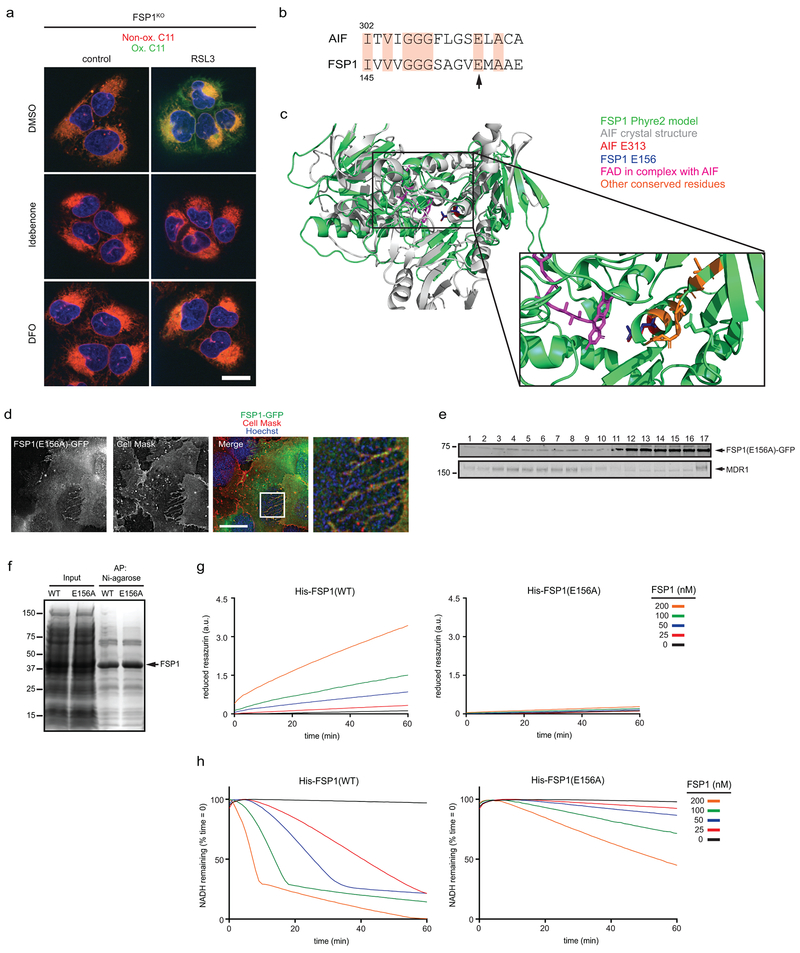
Extended Data Fig. 7. Analysis of the FSP1 oxidoreductase mutant.
a. FSP1KO cells were treated with 250 nM RSL3 and 10 μM idebenone or 50 μM DFO for 75 min, labeled with BODIPY 581/591 C11 and fixed prior to imaging. Ox. = oxidized; Non-ox. = non-oxidized. Images are representative of at least n = 10 cells imaged for each treatment condition. Scale bar = 20 μm. b, Sequence alignment showing residues conserved between AIF and FSP1. The arrow points to E313 in AIF (aligns to E156 in FSP1) that functions in FAD binding. c, Structural alignment between the crystal structure of mouse AIF (PDB 1GV4) and the Phyre2-generated model of FSP1. d, Live cell microscopy of FSP1KO cells expressing inducible FSP1(E156A)-GFP labeled with 5 μg/mL Cell Mask. The image is representative of at least n = 10 imaged cells. Scale bar = 10 μm. e, Plasma membrane subdomains from FSP1KO cells expressing FSP1(E156A)-GFP were enriched by OptiPrep gradient centrifugation. f, SDS-PAGE and Coomassie brilliant blue stain of recombinant His-FSP1(WT) and His-FSP1(E156A) purified with Ni-NTA agarose beads. g, Reduction of resazurin by recombinant FSP1 in the presence of NADH. h, Oxidation of NADH by recombinant FSP1 in the presence of coenzyme Q1. Figures g,h are representative of two biological replicates, and figure e shows a single experiment.

