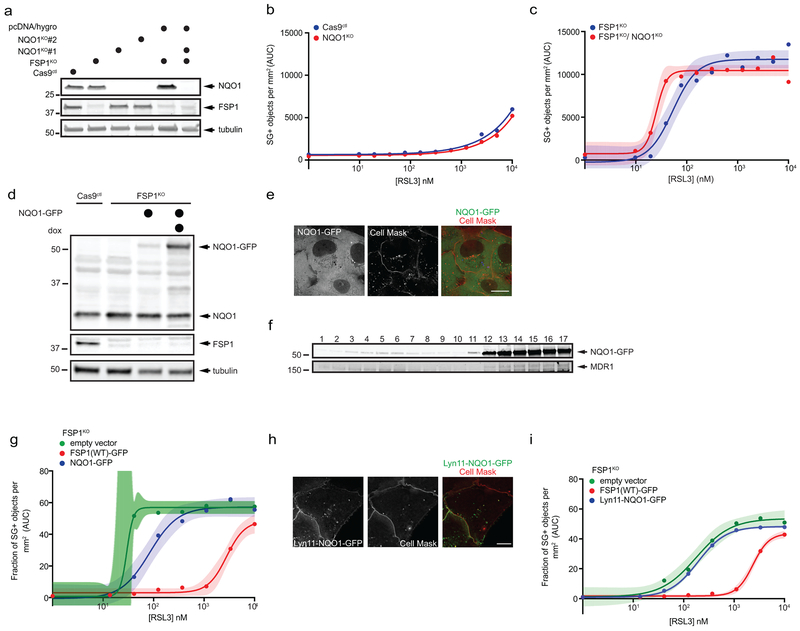
Extended Data Fig. 9. Role of NQO1 in ferroptosis resistance.
a, Western blot analysis of lysates from NQO1KO and NQO1KO/FSP1KO cells. b, Dose response of RSL3-induced death of control and NQO1KO cells. c, Dose response of RSL3-induced death of FSP1KO and NQO1KO/FSP1KO cells. Cells in (b,c) were generated using NQO1 sgRNA 1. d, Western blot analysis of lysates of FSP1KO cells expressing doxycycline-inducible NQO1-GFP. e, Live cell microscopy of inducible NQO1-GFP cells labeled with 5 μg/mL Cell Mask. f, Plasma membrane subdomains from FSP1KO cells expressing NQO1-GFP were enriched by OptiPrep gradient centrifugation. g, Dose response of RSL3-induced death of FSP1KO cells expressing the indicated inducible constructs. h, Live cell microscopy of FSP1KO cells expressing inducible Lyn11-NQO1-GFP cells labeled with 5 μg/mL Cell Mask. i, Dose response of RSL3-induced death of FSP1KO expressing the indicated inducible constructs. For figures b,c,g,i, shading indicates 95% confidence intervals for the fitted curves and each data point is the average of 3 technical replicates. Figures are representative of two biological replicates except figures f,I, which show the results of single experiments. For figures e,h, the images are representative of at least n = 10 imaged cells. Image scale bars = 10 μm.

