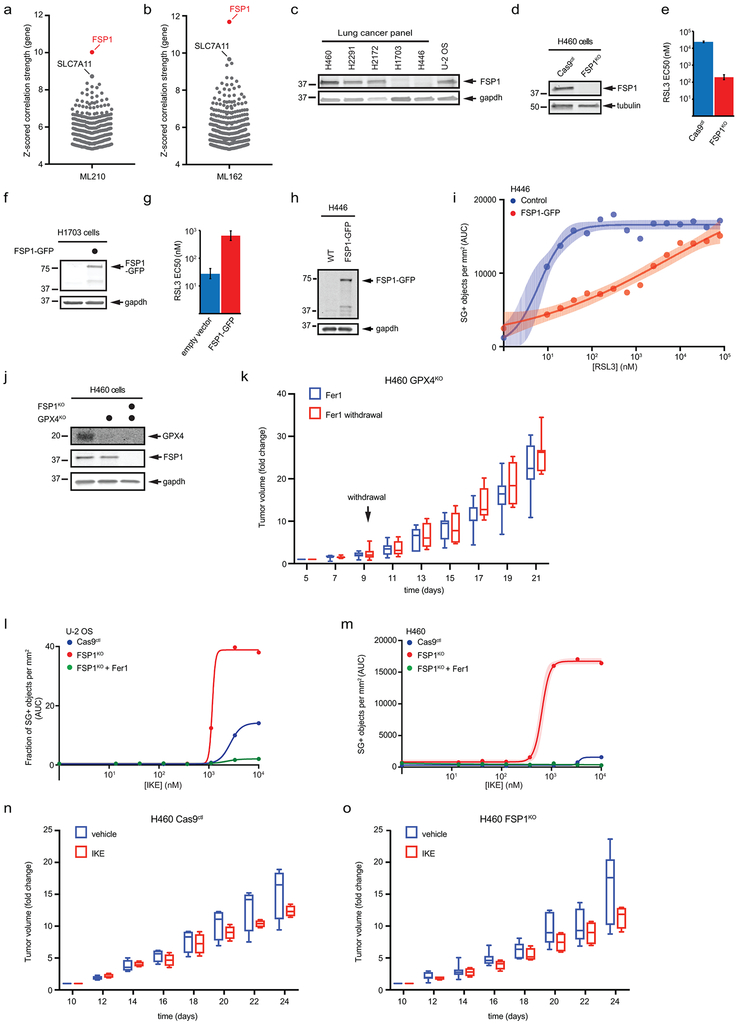
Extended Data Fig. 10. The role of FSP1 in cancer.
a,b, High expression of FSP1 is correlated with resistance to the GPX4 inhibitors ML210 (a) and ML162 (b) in non-hematopoietic cancer cells. Plotted data was mined from the CTRP database that contains correlation coefficients between gene expression and drug sensitivity for 907 cancer cell lines treated with 545 compounds. Plotted values are z-scored Pearson’s correlation coefficients. c, Western blot of FSP1 expression in a panel of lung cancer lines. d, Western blot of lysates from control and FSP1KO H460 cells. e, EC50 RSL3 dose for the indicated H460 cell lines was calculated from the results in Fig. 1d. Bars indicate 95% confidence intervals. f, Western blot of lysates from control and H1703 cells. g, EC50 RSL3 dose for the indicated H1703 cell lines was calculated from the results in Fig. 1e. Bars indicate 95% confidence intervals. h, Western blot analysis of H446 cells expressing doxycycline-inducible FSP1-GFP. i, Dose response of RSL3-induced death of control and FSP1-GFP H446 cells. j, Western blot of lysates from GPX4KO and GPX4KO/FSP1KO H460 cells. k, GPX4KO H460 tumor xenografts cells were initiated in immune-deficient SCID mice (n = 16). Following 5 days of daily Fer1 injections (2 mg/kg) to allow lines to develop tumors, one set of mice (n = 8) continued to receive daily Fer1 injections and a second set (n = 8) received vehicle injections for the remaining 17 days. The distribution of fold changes in sizes of individual tumors during the treatment is shown. GPX4KO (−) Fer1, n = 7; GPX4KO (+) Fer1, n = 7. l, Dose response of IKE-induced death of control and FSP1KO U-2 OS cells. m, Dose response of IKE-induced death of control and FSP1KO H460 cells. n,o, Control (n) and FSP1KO (o) H460 tumor xenografts were initiated in immune-deficient SCID mice (n = 16). After 10 days, each group of mice (n = 8) was injected daily with 40 mg/kg IKE or vehicle. The distribution of fold changes in sizes of individual tumors during the treatment is shown. Cas9KO (−) IKE, n = 4; Cas9KO (+) IKE, n = 4; FSP1KO (−) IKE, n = 7; FSP1KO (+) IKE, n = 4. For figures k,n,o box plots show median, 25th and 75th percentiles, minima and maxima of the distributions. Figures are representative of two biological replicates expect figures l,m, which show the results of single experiments. For figures i,l,m, shading indicates 95% confidence intervals for the fitted curves and each data point is the average of 3 technical replicates.

