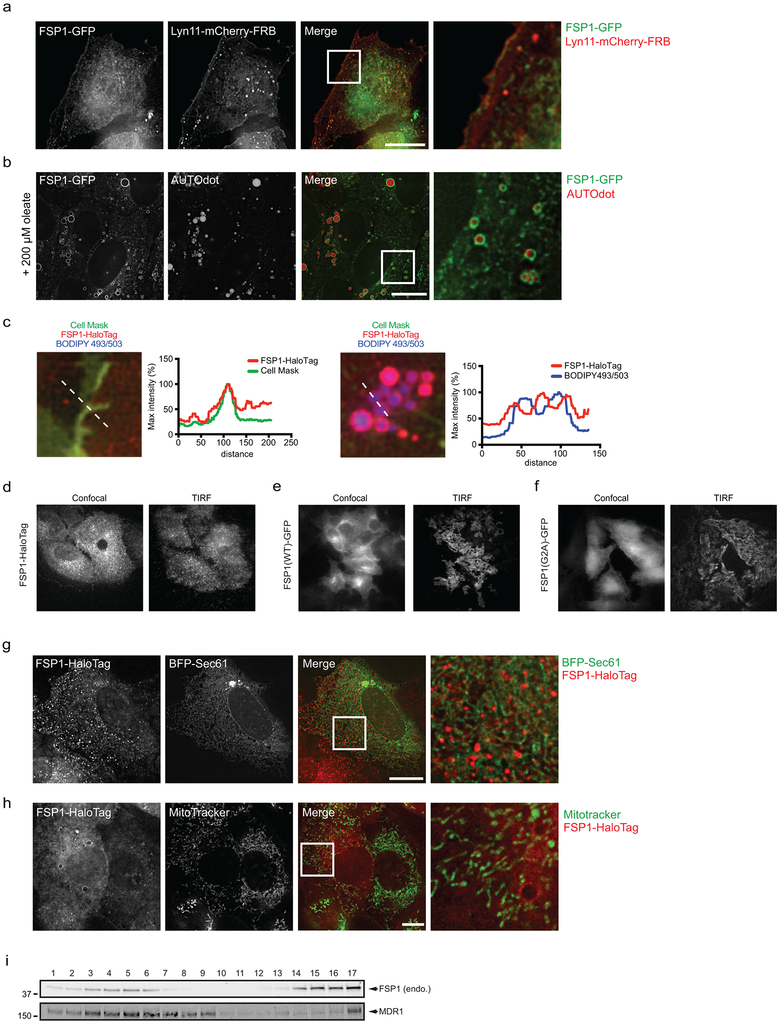
Extended Data Fig. 2. Subcellular distribution of FSP1.
a, Inducible FSP1-GFP cells were transiently transfected with Lyn11-mCherry-FRB for 24 hr, induced with doxycycline for 48 hr and fixed prior to imaging. b, FSP1-GFP cells were treated with 200 μM oleate for 24 hr to induce LDs and treated with 100 μM AutoDOT to label LDs prior to imaging. c, Line intensity plots showing colocalization between FSP1-HaloTag and organelle markers. d-f, Confocal and TIRF microscopy of FSP1-HaloTag (d), and inducible FSP1(WT)-GFP (e) and FSP1(G2A)-GFP (f) cells. g, FSP1-HaloTag cells were transiently transfected with BFP-Sec61 for 48 hr prior to imaging to label the endoplasmic reticulum. h, FSP1-HaloTag cells were incubated with 100 nM MitoTracker Green FM to label mitochondria. i, Plasma membrane subdomains from control cells were enriched by OptiPrep gradient centrifugation. Endo., endogenous FSP1. Western blot is representative of two biological replicates. Images are representative of at least n = 10 imaged cells. Image scale bars = 10 μm.

