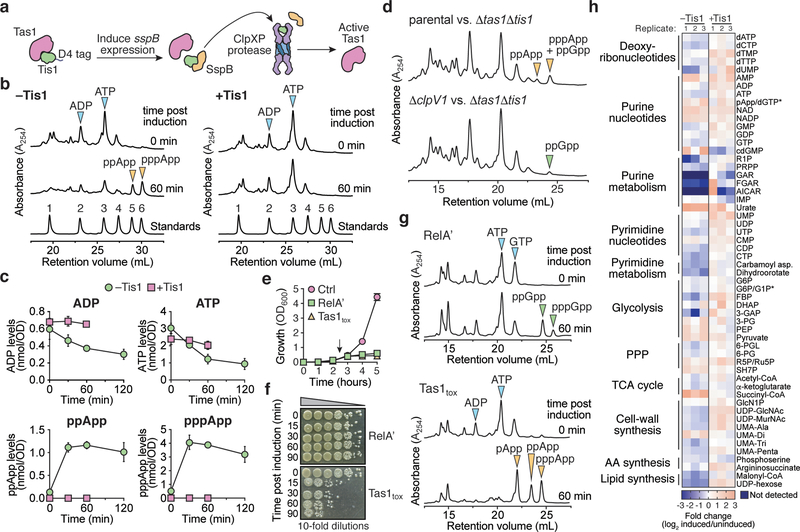
Figure 3 |. Tas1 intoxication depletes cellular ADP and ATP resulting in dysregulation of central metabolism.
a) Schematic of the inducible Tis1 degradation system used to generate active Tas1 in P. aeruginosa cells. Induction of sspB expression results in degradation of D4-tagged Tis1 by the ClpXP protease23. b) (p)ppApp accumulates in Tis1-depleted P. aeruginosa cells. Anion-exchange chromatography separated metabolites extracted from a P. aeruginosa PA14 parental strain (right, ΔretS ΔsspB pPSV39-CV::sspB) and a derivative expressing tis1-D4 (left, ΔretS ΔsspB PA14_01130-DAS+4 pPSV9-CV::sspB) before or 1-hour after induction of sspB expression. Blue and orange arrowheads indicate peaks of adenosine 5′-nucleotides and (p)ppApp, respectively. A standard trace of an equimolar mixture of 1-AMP, 2-ADP, 3-ATP, 4-pApp, 5-ppApp and 6-pppApp using the same gradient is shown for comparison. c) Absolute quantification of ADP, ATP and (p)ppApp levels in the P. aeruginosa strains from (a) as a function of time post induction of Tis1 depletion. d) Anion-exchange chromatography traces of metabolites extracted from growth competition experiments conducted on solid media for 2.5 hours. The parental strain is P. aeruginosa ΔrsmA ΔrsmF. e) Growth curves of E. coli cells expressing either the (p)ppGpp synthetase domain of RelA (RelA′), Tas1tox or a vector control (Ctrl). Arrow indicates time at which inducer was added to cultures. f) CFU plating of E. coli cells expressing the plasmids defined in (d). Cells were plated either pre-induction or at the indicated times post-induction on inducer-free agar. Representative CFU plates from three biological replicates are shown. g) Anion-exchange chromatography traces of metabolites extracted from strains in (d) either pre-induction or 1-hour post-induction. Arrows indicate relevant metabolites isolated from culture. h) Relative levels of metabolites from P. aeruginosa containing or lacking Tis1. Heat map shows metabolite levels calculated for both the +Tis1 and –Tis1 strains as a log2 ratio for samples 1-hour post-induction relative to pre-induction of sspB expression. The asterisk indicates metabolites that are indistinguishable in our LC-MS analysis. The metabolic pathway or classification for each metabolite is shown on the left. Data for three biological replicates are shown. c, e) Data are mean ±SD for three biological replicates. b, d) Representative traces from three biological replicates are shown.

