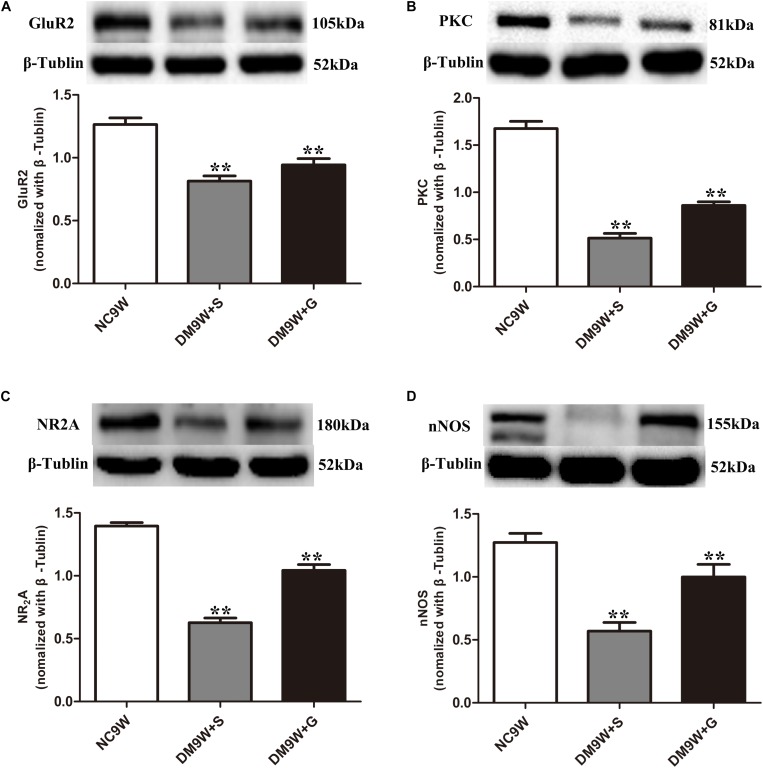
FIGURE 4.
Western blot analysis of GluR2 (A), PKC (B), NR2A (C), and nNOS (D) protein expression levels in the cerebellum in the NC9W, DM9W + S, and DM9W + G groups, including the immunoreactive bands of GluR2 (105 kDa), PKC (81 kDa), NR2A (180 kDa), nNOS (155 kDa), and β-Tubulin (52 kDa). Bar graphs representing optical density (mean ± SD). Note the expression levels of all biomarkers were significantly decreased after diabetes induction (DM9W + S) but were significantly reversed after gastrodin intervention (DM9W + G). ∗∗p < 0.01.

