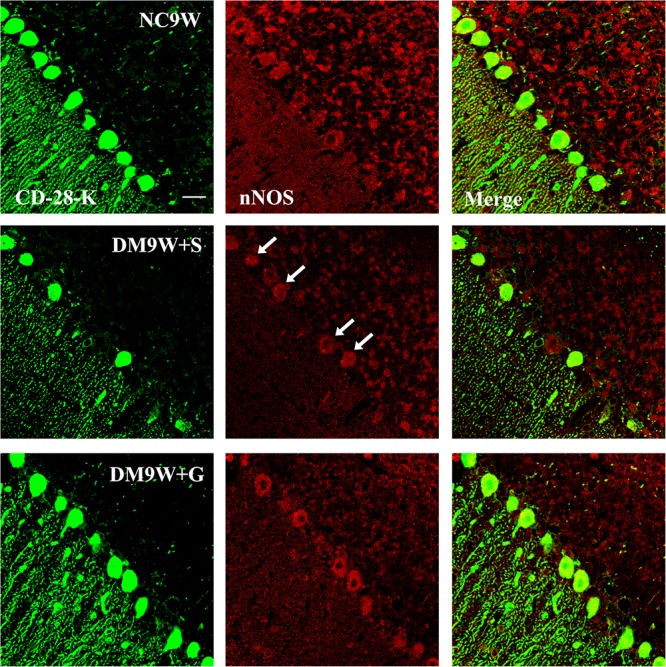
FIGURE 7.

Representative photomicrographs showing CD-28K (green) and nNOS (red) double-labeled Purkinje cells in the cerebellum in the NC9W, DM9W + S, and DM9W + G groups. Note the diminution of nNOS immunofluorescence in Purkinje cells in the DM9W + S group (single arrow) as compared with the normal control (NC9W). nNOS immunofluorescence, however, was restored to a level comparable to that of the normal in DM9W + G. Magnification: ×600. Bar = 20 μm.
