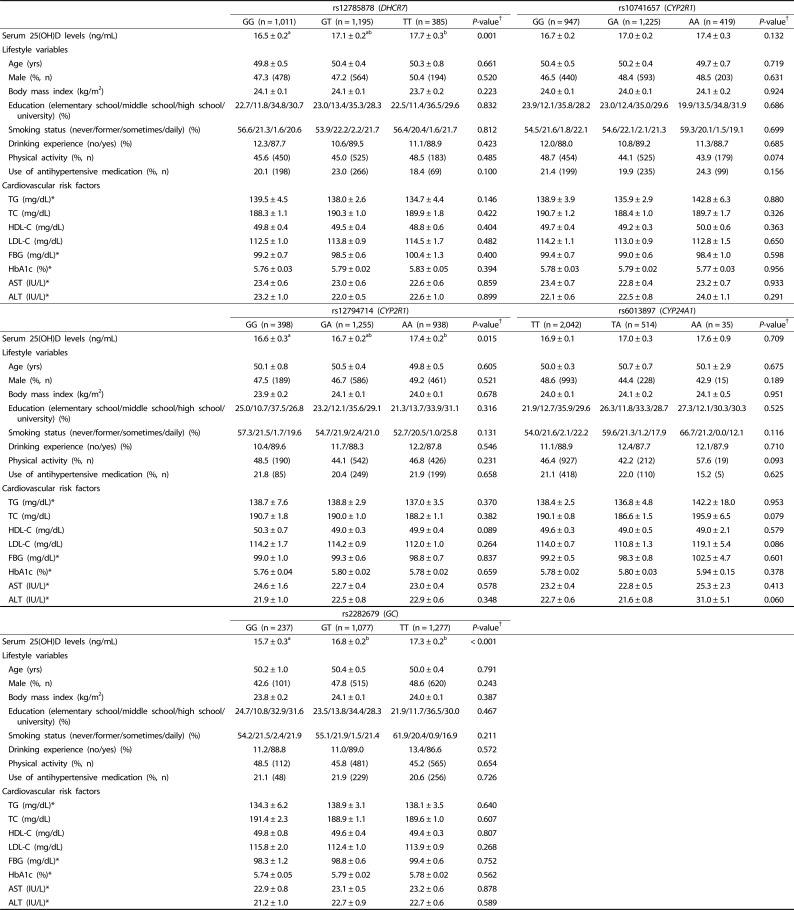
Table 2. Characteristics of the study participants according to the genotype.
Values are expressed as means ± standard errors for continuous variables and number of counts and percentages for categorical variables in an increasing order of serum 25(OH)D level-increasing alleles.
†Statistical differences among genotypes were determined using one-way ANOVA with Bonferroni's multiple comparison for continuous variables and chi-squared test for categorical variables.
*Tested after log-transformation.
TG, triglycerides; TC, total cholesterol; HDL-C, high-density lipoprotein cholesterol; LDL-C, low-density lipoprotein cholesterol; FBG, fasting blood glucose; Hb1Ac, glycosylated hemoglobin A1c; AST, aspartate aminotransferase; ALT, alanine aminotransferase.

