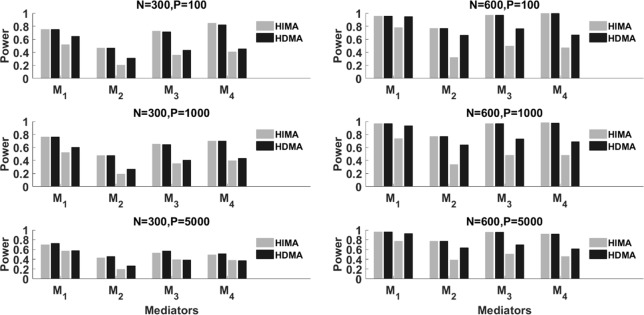
Figure 2.
The power of HIMA (light gray) and HDMA (black) under different sample sizes, data dimensions, and correlations. M1∼M4 refer to the first four significant mediators. There are four power bars corresponding to each mediator. The left and right two bars correspond to the case with correlation ρ=0 and 0.8 respectively.

