Fig. 3.
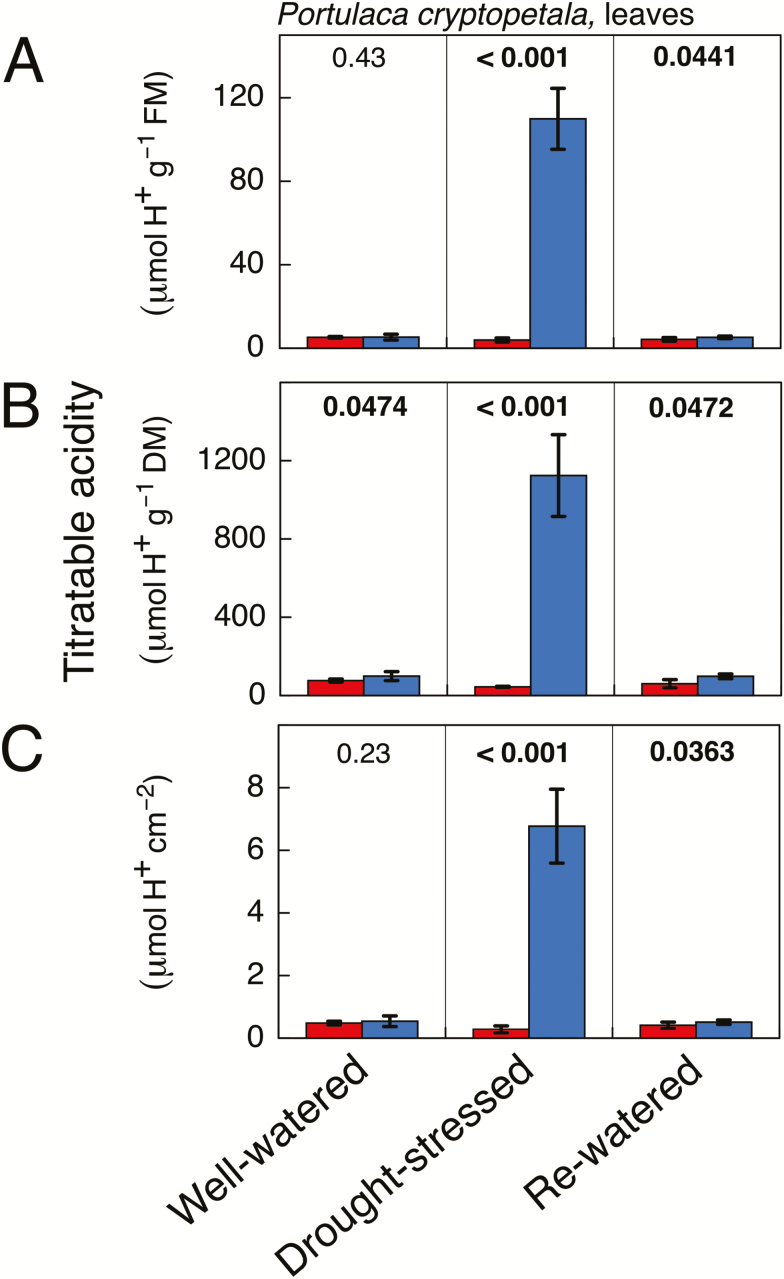
Titratable acidity in recently fully expanded leaves of Portulaca cryptopetala at the end of the 12 h light period (red) and the end of the 12 h dark period (blue) in plants that were well-watered (left-hand column), droughted (middle column; 9 d without irrigation) and droughted and rewatered (right-hand column; 3 d with irrigation). The data are expressed on a fresh mass basis (A), a dry mass basis (B) and a leaf area basis (C). Mean ±SD (n=5 leaves; at a given time point each leaf was harvested from a different plant). The numerical values shown above the bars are P values (one-tailed t-test). Bold letters indicate that the values at the end of the dark period were significantly greater than those at the end of the day at P≤0.05.

